In trading, there is a saying that the market always goes up until it comes crashing on your head. To some extent, the statement holds a modicum of truth.
But it would be more appropriate to say that the market has cycles. It rallies and sometimes descends into a tailspin.
Typically, traders design their strategies around these cycles, both short-term and long-term.
Position trading takes a long-term view
In foreign exchange trading, you are either a short-term or long-term investor. First, however, we must define these two terms within the context of forex.
Forex traders consider themselves long-term investors when they hold a position from a few weeks to several years. Now, it might appear ridiculous, but some traders hold market positions for quite some time.
Since it is not sexy to call them “long-term traders,” the market had to find a more fitting name, position traders. So, position trading refers to forex trading strategies built around a long-term view of the market.
Characteristics of position trading
Say you are a novice finding a hard surface for support as you wade through the forex market. So, how will you know that the strategy you’re following is really position trading? Below are a few things to look out for.
A long-term view of the market
We already discussed that position traders hold a position for extended periods, often weeks but could reach years. Specifically, the traders identify trends in forex pairs that can continue for relatively long periods and generate income. The beauty of holding on for this long is that you get to avoid high transaction costs, which often eat a lot into traders’ earnings.
Heavy reliance on fundamental analysis
Depending on the strategy, you’ll find yourself relying on one or both of the two techniques for market research – fundamental and technical analysis.
Fundamental analysis involves examining the financial and economic indicators related to the forex pair in question. In addition, the analysis includes studying factors like the state of the underlying economy and interest rates.
The ultimate goal of fundamental analysis is to obtain the intrinsic value of the given currency pair. Intrinsic value refers to the pair’s long-term value regardless of intraday gyrations.
The trading activity is less demanding
Position traders spend less time analyzing the market, and decision-making is less exacting. Earlier, we said fundamental analysis is all about the future outlook of the forex pair at hand.
But on the opposite side is technical analysis, which is a favorite for short-term traders. Technical analysis is all about examining a forex pair’s price action over small intervals of time, sometimes even seconds.
To analyze price and volume is taxing, primarily because you need to examine the behavior of several indicators. Sometimes you might need to spend hours in front of a screen to monitor charts. This does not happen for position traders.
Position trading strategies
All primary approaches to forex trading, such as position trading, swing trading, and scalping, have a broad view of the market. They offer the general guiding principle one should follow when designing and executing a strategy.
There are several strategies you could deploy for position trading, but this article will only discuss the two most familiar. They are:
- Support and resistance trading strategy
- Pullback and retracement trading strategy
Support and resistance trading
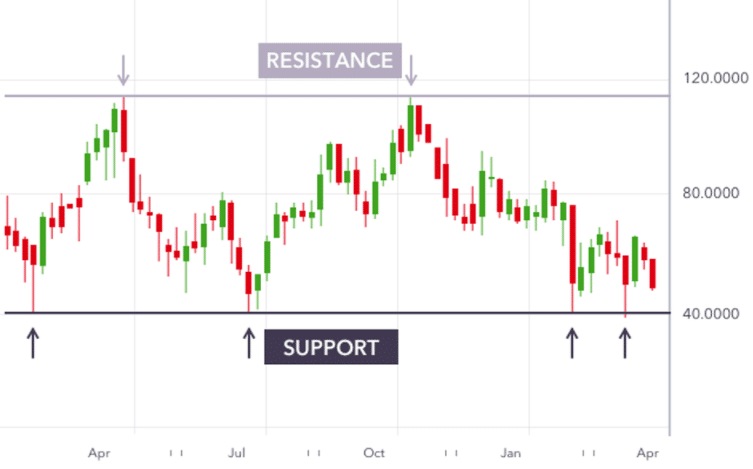
There are two critical levels in the financial markets: support and resistance. Examining the two helps you predict where an asset’s price is likely to be in the future. Thus, the assessment should tell you when to open a position and how long you should hold it.
A support level is the price area below which a currency pair is unlikely to fall. If the pair approaches the level, the buying pressure builds, and the price may soar upwards.
On the opposite side is the resistance level. This is the furthest price point that an asset can rise because buyers tend to fizzle out, fearing an impending trend reversal.

This strategy watches out for anomalies, such as the price breaking above resistance or below support levels. If the former happens, it could indicate an oncoming upsurge in price action. On the contrary, the latter could indicate the price is on the way to hitting lower bottoms.
Obviously, such analyses will need the backing of fundamental analysis because position trading does not interest itself with intraday fluctuations.
Pullback and retracement trading
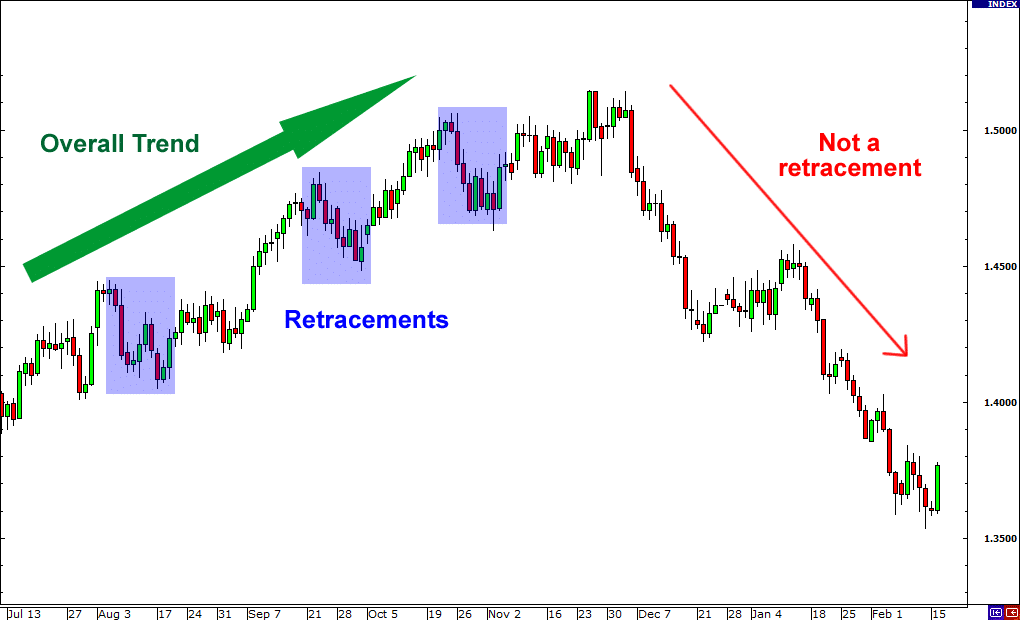
One week is a long time in forex, where the price could go up and down several times. But seen from the broad perspective of position trading, sometimes the price trends upwards or declines consistently for days. Then, the prevailing trend breaks, and the price launches into a brief dip. This scenario refers to a pullback.
If the fundamentals are strong, traders should expect the forex pair to retrace the initial trend and continue upward.

Trading pullbacks and retracements are exciting if you understand what is happening. The trick here is to catch the dips before they bottom out to earn the maximum returns from the scenario. However, this means you must be able to identify the dips in good time.
To this end, indicators like the Fibonacci retracement are invaluable. The indicator breaks the chart into levels ranging from 0% to 100%. In between, there are levels 23.6%, 38.2%, and 61.8%. Although unofficial, you could regard the 50% line as a Fibonacci retracement level.
The indicator plots the levels automatically, and all you have to do is identify the support and resistance levels and possible breakouts.
Final thoughts
Position trading is ideal for beginners, but it is not without risks. In the first place, unexpected massive trend reversals can inflict catastrophic losses on the trader. Secondly, position trading locks up your capital for extended periods, which translates to low liquidity.