In order to reduce risk and increase the potential profit, most traders utilize the strategy of trading in the direction of strong trends. One of the forex indicators that allow traders to determine the price trend is the Average Directional Index or ADX. Many even consider it to be the most useful trend strength indicator, and for good reason too. In this guide, we examine ADX, its history, adjustment, and some of its basic strategies that can be beneficial to traders.
What is ADX?
As a technical analysis indicator, the ADX quantifies the strength of a price trend. It provides the moving average of expanding price range values. Traders usually use the 14-bar settings that are its default.
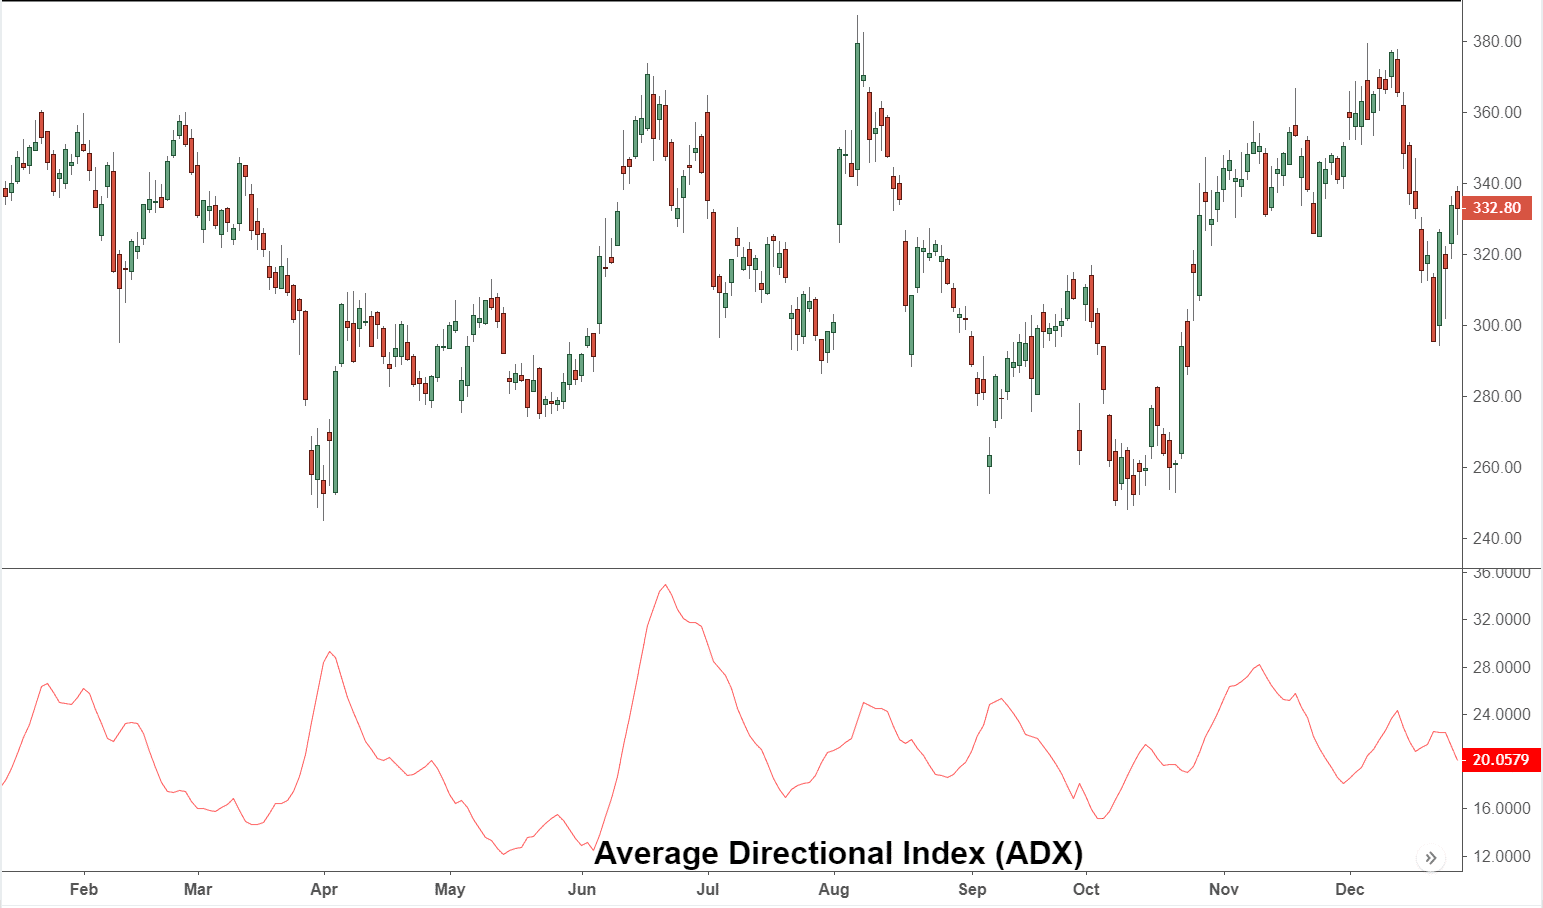
Plotted as a single line, ADX values range between 0 and 100. It does not indicate a direction and is used only to determine trend strength, whether the trend is up or down.
The two-directional indicators, positive (+DMI) and negative (-DMI) are also plotted with the ADX as the latter is derived from the former.
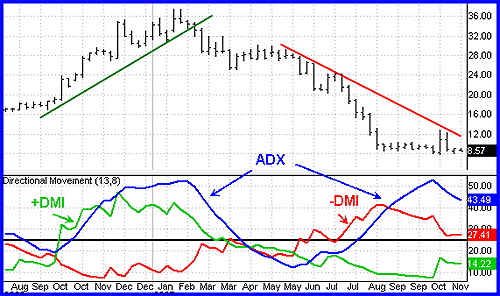
Therefore, you will find three different lines included in the ADX, as shown above. These make it easier for a trader to decide whether to go long or short or even if to trade at all. Prices are up and the ADX measures the uptrend strength when the +DMI is higher than -DMI. Conversely, when the -DMI is higher than +DMI, the ADX is measuring the downtrend strength.
The image given above is an example of an uptrend followed by a downtrend. The ADX rises when the uptrend as the +DMI (green) is above -DMI (red). As it reverses and -DMI crosses +DMI, the ADX rises again highlighting the downtrend strength.
History of ADX
It was J. Welles Wilder that introduced the idea of ADX. It was in 1978 that he published ‘New Concepts in Technical Trading Systems,’ a book that contained the indicator ADX as well as other indicators, which are still used to this day such as Parabolic SAR, Average True Range, and Relative Strength Index. Such indicators were never deliberated before but they are still used by many traders today who may not be aware of their origin.
What’s so bewildering about the book is that it was written and published prior to the advent of computers when calculations were still done by hand. Even then it provides all the instructions on how to calculate ADX.
How ADX can be adjusted and how is it useful for traders?
The ADX reading is calculated based on the trading periods of the chart. The default setting is 14 periods, as first used by Wilder, though this can be adjusted to suit the trader’s style.
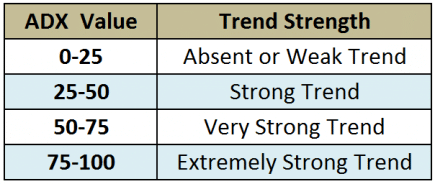
When adjusting the setting, traders generally choose between 7 and 30 periods. Similarly, different ADX values correspond to different trend strength.
If the ADX is, let’s say, 28, it is considered a strong trend. Using different settings also affects how the ADX readings are highlighted on the chart. When using a high setting, the average price is smoothened and over a long period of time as shown below.
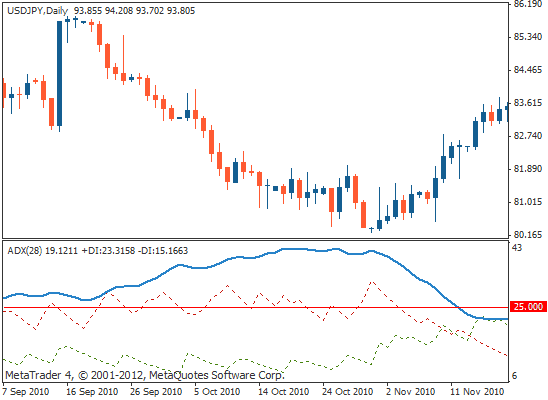
This results in a reliable reading of the trends, though it also may take longer to recognize. It is possible that on higher settings by the time you are alerted of the trend, a big chunk of the price trend is foregone
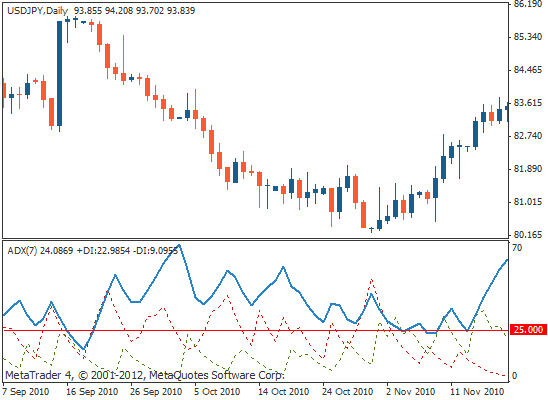
On the other hand, using a low setting does allow you to detect more trends earlier. But do note that some of these so-called ‘trends’ are nothing but slight aberrations of a larger trend. This is shown below in the choppiness of the ADX line when the indicator is at 7 periods.
Basic Strategies using ADX
The first thing that a trader must do is to read the price on the chart. Since this is the most important signal, it is in this context should they read the ADX. Using such indicators is valuable only when it provides us with some useful information that price alone cannot tell.
Trend Momentum
A trader can identify the most profitable and the strongest trends by quantifying the trend strength. Through the visual representation of peaks, ADX is able to indicate with clarity the momentum of the trend. Momentum is nothing but price velocity. If there are multiple ADX peaks close by, this means that there is an increase in momentum. Conversely, multiple lower peaks indicate a falling momentum.
It should be noted that even if the peak is low if it is above 25 it is considered strong.
Being aware of the trend momentum allows a trader to be confident enough to let profits amass rather than exiting prematurely. At the same time, if there are multiple low-ADX peaks, it may be time to reassess the risks and watch the price.
Breakouts that result from an imbalance between demand and supply create price momentum. They are easy to spot but may sometimes not have a longer progression and that can entrap a trader. However, traders can know if a breakout is valid by looking at the strength of the ADX trend after the breakout.
Range Finder
It can be hard to know exactly when the price has moved from trend conditions to range conditions. But ADX does show when there is a weakening of the trend and when it is moving into range consolidation. It is only when the ADX falls from over 25 to below 25 that range conditions exist. In a range, there is a general agreement for a price between sellers and buyers and the trend is sideways. Until the balance of demand and supply changes, ADX will continue to move sideways under 25.
When combined with price action, ADX provides amazing strategy signals for the traders. It is best to use to determine whether or not the prices are trending using ADX. Thereafter, choose the appropriate strategy for the condition.
Entries should be made on pullbacks in trending conditions and taken in the general direction of the trend. Though trading strategies based on trends are not appropriate for range conditions, trades can still be made on reversals. Trade should be taken long at support, and short at resistance.
Furthermore, trade signals are also generated with crossovers between +DI and -DI lines. For instance, if ADX is above 25 and the -DI goes beyond +DI, then entering a potentially short trade is a possibility. The same crossover can also be used to exit existing trades, for instance, if you are long. But it may not be the best time to enter if there is no price trend and ADX is below 25.
The Bottom Line
The strongest trends are the ones that provide the most profits. ADX does not only help a trader to identify the conditions but also to know which trends to trade. Traders get a further edge with ADX’s ability to quantify the strength of the trend.
As a trend strength indicator, it also highlights when the price has moved out of range with enough strength so as to utilize strategies for trend trading. ADX also addresses risk management as the trader is alerted to any change in the trend momentum.