The Money Flow Index is a popular tool for market analysis that professionals and experienced traders rely on globally. It is a powerful technique to observe the flow of money for an asset at any particular time. Read further to understand how you can apply the MFI effectively for more profitable trading.
What is the Money Flow Index (MFI)?
The money flow index or MFI is a technical and financial indicator used to check whether a security is oversold or overbought. A security is said to be oversold when it functions at a price below its reasonable price. It is overbought when it functions at a price above or higher than its reasonable price. Such securities are generally followed by trend reversals to achieve their equilibrium prices. Investors need to know as and when securities are overbought or oversold since this decides whether the upcoming reversal will lead to an uptrend or a downtrend.
The money flow index takes both the security’s price and the volume into account to check its pricing mechanism. Time is an important factor for the MFI. Being an oscillator, it marks high and low values during a fluctuating market and registers any anomalies in the prices. This helps traders to determine the behavior of both present and future prices. It also helps determine how much money has flown towards or away from the asset. The MFI makes it easy for traders to read the market conditions and make informed decisions.
It is important to note that although the relative strength index and the money flow index work similar to each other, they give different results. Where the RSI only takes price into account, MFI uses volume as an indicator to provide a more precise market analysis.
Constructing the Money Flow Index:
The construction of the money flow index is quite simple. The formula for its calculation is as follows:

where,


To calculate the money flow index, follow these simple steps:
- Measure the typical price for the previous positive and negative 14 periods. You can measure the typical price by dividing the sum of high, low and close prices for each period by 3.
- Take the set of typical prices for each period and check whether it has positive money flow or negative money flow. Note that the increment in price following a money flow period is taken as a positive typical price for that period. A decrement in price following the previous money flow period is taken as a negative typical price for the current period.
- Then, measure the raw money flow for each period. Multiply the typical price of each period to the volume registered during that period. A positive typical price will add to a positive raw money flow. A negative typical price will lead to a negative money flow.
- Take both positive and negative money flow values for 14 periods each.
- Now, you can measure the money flow ratio by taking 14 positive money flow values over 14 negative money flow values.
- Once you have the money flow ratio, measure the money flow index as follows. Subtract the money flow ratio from 1, then divide 100 by that value. Finally, subtract the value derived from 100 to get your MFI.

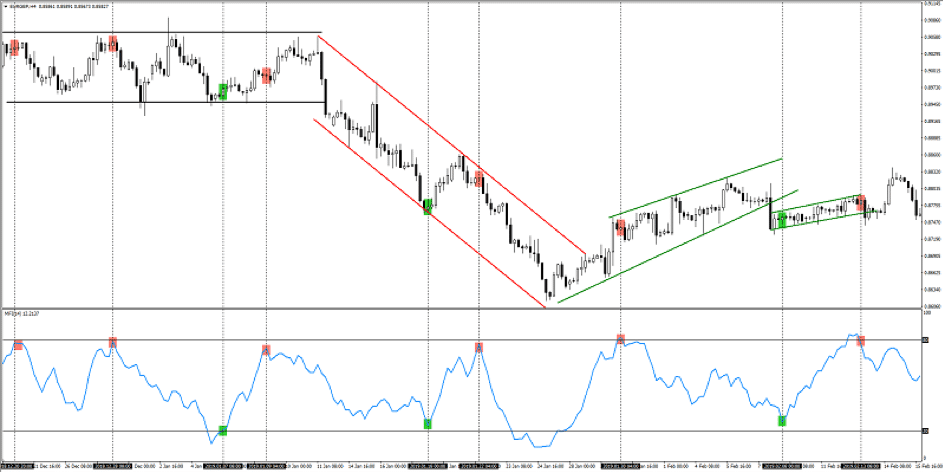
A typical MFI with high and low lines to register overbought and oversold periods.
What’s on Practice? Examples and Uses
- Checking Overbought or Oversold Securities: The value of the money flow index lies between 0 and 100. Generally, a range of money flow above 80 is considered as overbought and the values below 20 are taken as oversold. Sometimes, the values 90 and 10 are also used as the markers.
- Checking Trend Reversals: The MFI is predominantly used to verify trend reversals. It is very useful in checking for divergences in the price mechanism. A divergence occurs when the indicator and the price function opposite to each other. For example, when the price rises while the indicator registers a fall in its value, this is a divergence. After a divergence, the trend usually reverses so that the security realizes its fair price.

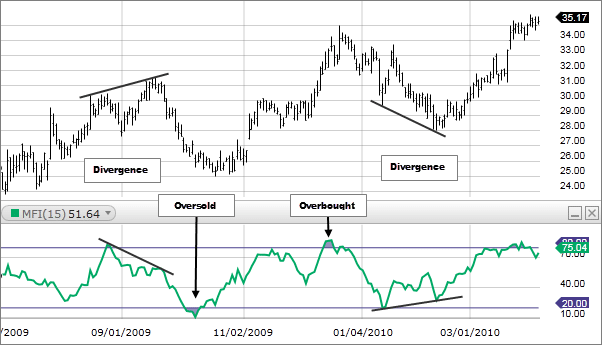
Consider the representation of the money flow index shown above. The margins 20 and 80 are set as high and low values for the MFI. When the value of MFI rises above 80, it registers a signal for overbought assets. When it falls below 20, it is a signal for oversold assets. You can notice the price chart where divergences occur, which are followed by trend reversals. There are multiple high and low points which are immediately succeeded by trend reversals in the price chart.

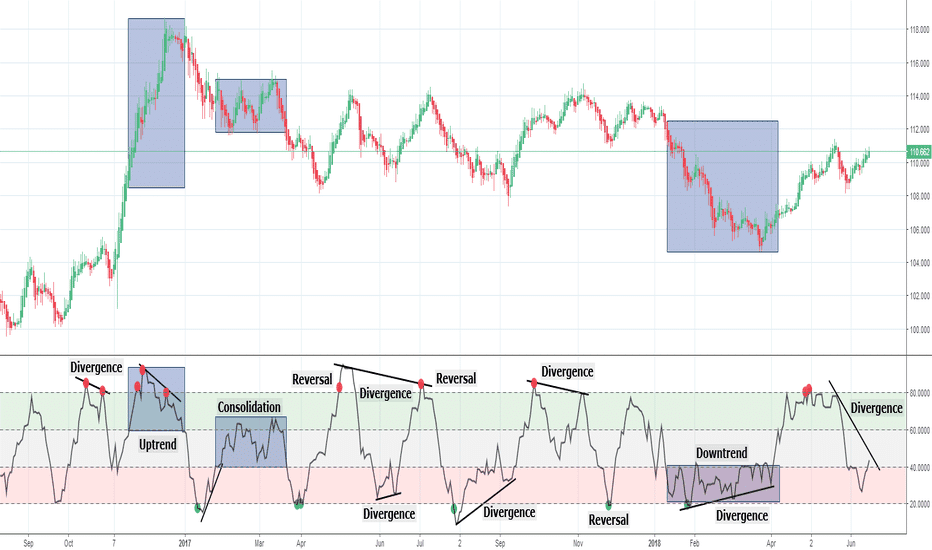
Along with the usual trend reversals following the divergences, the money flow index is also marked by a period of consolidation. This is a period where no particular trend sustains for a long time. The market fluctuates often with no string signals to make decisions. Notice the first uptrend, the MFI remains overbought for a long time. This happens during strong trends where the MFI denotes overbought or oversold securities for prolonged periods.
Conclusion
The money flow index is a critical tool to learn for efficient and profitable trading. You can employ it for a comprehensive analysis of the market. Using both price and volume as variables, it provides accurate information about overbought and oversold assets. However, the money flow index can also produce false signals sometimes. To overcome this problem, It is usually clubbed with other technical indicators for most accurate results.