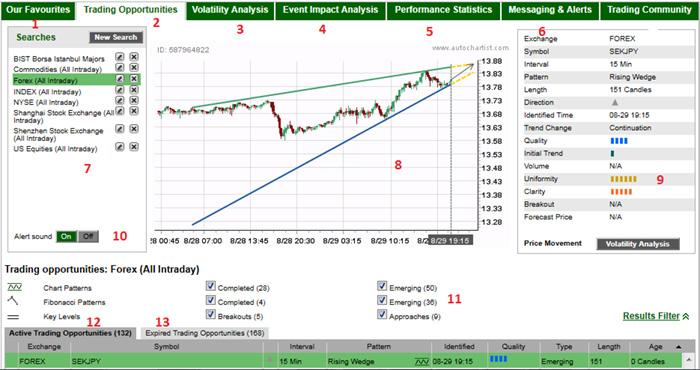
Autochartist is certainly one of the most popular technical trading software tools. It is available in two forms as a web interface and as a plugin for MT4, MT5 and jForex platforms. It is scanning different trading instruments and time-frames and helps you to recognize various graphical pattern setups. The tool is very popular because many brokers offer it for free. It is serving over 50 brokers, over 50 000 traders worldwide are receiving more than 400 000 signals monthly. If your broker does not offer the tool you can still use it as it can be purchased at www.autochartist.com. A monthly subscription is $49.95 with a 14 day free trial period.
Autochartist is constantly scanning different trading instruments and time-frames as it is looking for potential trading signals. In that manner, it is saving the traders time and also it is improving its performance because when the signal appears the tool will notify you promptly. The application is looking for chart patterns, Fibonacci retracement levels, and support and resistance levels. It monitors the market 24 hours a day throughout a week and it is available in various languages. It can send alerts and market reports via email. On the official website, you can find lots of educational materials, articles, videos, eBooks, and webinars.
How to use Autochartist
If your broker does not include Autochartist into its MetaTrader installation, do not worry because the installation process is very simple. After downloading, just start the installation file and the application will be installed on your MetaTrader instance. Now, start the trading platform and in Navigator panel under Expert Advisors find Autochartist EA. Drag the robot into a chart like any other EA and you will be ready to use it. In case you do not want to use the tool as a trading platform plugin, all functionality is available throughout the web interface.
Market Scanner is informing the trader about possible entries as it is searching for graphical chart patterns, including triangle, wedge, flag, channel, rectangle, head and shoulders, double and triple tops and bottoms. It also identifies main support and resistance levels, ABCD, butterfly, and Gartly pattern. For every pattern, you will be informed about its length, a number of candles that are forming the pattern, and about the time of formation. You will also know whether the pattern is a continuation or a reversal one, what is a trend and what is a projected price. Moreover, the tool provides the details about the strength of the pattern, it can help to determine how many resources you should risk if you decide to accept the signal. The service can send you signals via email and you may choose what signals you want to receive.

Volatility analysis tells you what is the probable price range for the next candle on the time-frame. Average price movement per day is given for a whole previous week. During the day average hour movement is shown for the past 12 hours. You will be informed about the probability of the predicted price range.
Event impact analysis tells you what is the effect of the economic news release to on a certain trading instrument. For every release, you will see how it differentiated from the consensus and what was the impact on the trading instrument after 4 hours, after 12 hours and after 2 days. Only news releases from world-leading economies are taken into account and you will be informed if there is a correlation between the trading instrument and the release.
A complete statistical record of the performance is provided. For every trading signal that was released in the previous 6 months, you can see how it ended up. Total number of patterns, number of correctly predicted patterns and win rate data are provided not only overall but also by pattern, by time-frame, by trading instrument and by direction. This will certainly help you to determine how risky the next Autochartist signal will be.
So, Autochartist is a market scanning tool that is searching for chart patterns over different trading instruments and time-frames. It is helping the trader to recognize the trading opportunities more quickly. It also provides a forecast about the volatility and the impact of the economic news releases. For every pattern, the complete statistics are available for the period of the previous six months.