In 1978, J. Welles Wilder Jr., a well-known American technical analyst, introduced the ATR indicator in his book “New Concepts in Technical Trading Systems.” Welles is the creator of a number of major technical indicators that are now considered essential trading tools. He also created the Relative Strength Index (RSI), the Average Directional Index, and the Parabolic SAR. Despite the fact that Wilder’s technical indicators were created before the digital age, they have endured the test of time and remain quite popular among traders.
What is ATR?
Average True Range is a single-line volatility tool. Volatility is the pace at which the price fluctuates in relation to the average. The indicator moves up and down as price swings in an asset become smaller or larger. As each time period passes, a new ATR reading is calculated. For example, on a monthly chart, a new ATR is calculated each month. Traders can examine how volatility has changed over time by plotting all of these values into a continuous line.
Cryptos are very volatile; thus, the indicator works well in assessing the degree of volatility and assists traders in predicting when the price of the underlying coin is going to become more or less volatile.
Calculations
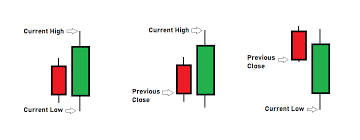
You must first create a set of true ranges to calculate the ATR manually. You may find the true range of a period by calculating the following and finding the sum:
- Taking the current high and subtracting the previous close.
- Taking the current low and subtracting the previous close.
- Taking the current high and subtracting the current low.

Formula

P = The number of periods. The common ones are 14 and 20.
TR = True range (from the calculations above).
When the ATR line rises, it means the underlying asset’s volatility is increasing; when the ATR line drops, the underlying asset’s volatility decreases.
Strategies
Predicting breakouts
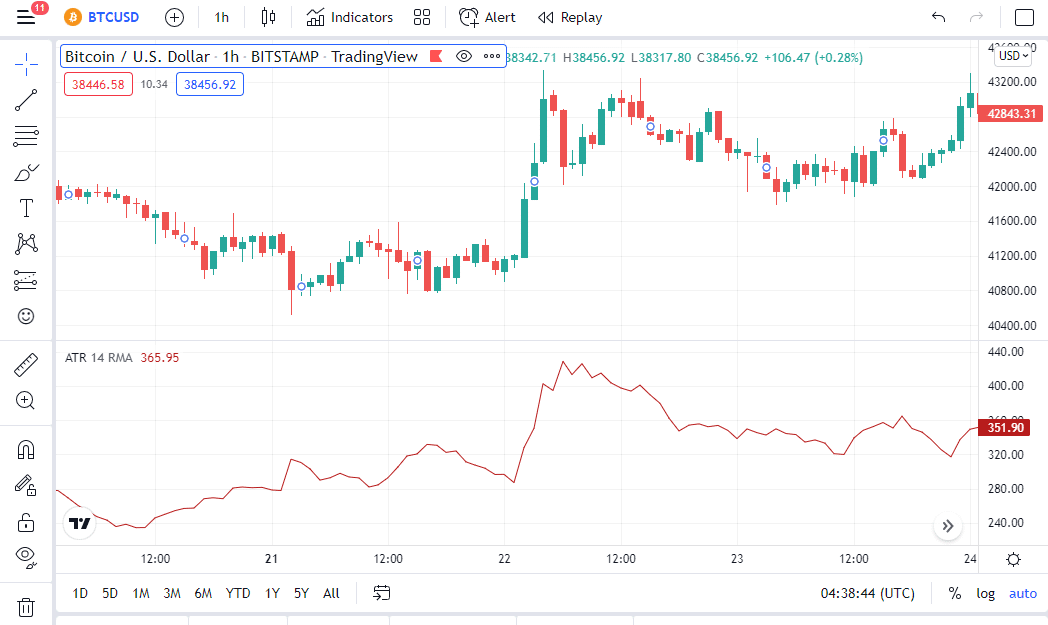
Breakouts provide some of the best trading opportunities when trading crypto or FX. A breakout refers to when the price of an asset rises above a resistance level or falls below a support level. Usually, when they manifest, the price may stage a large movement in their direction. Breakouts, which are characterized by high volatility, often occur after prolonged periods of market consolidation. When the price consolidates, the ATR will display low values.
The ATR aids traders in timing these breakouts correctly, allowing them to get right into the new trend. After a period of low or flat readings, an increase in the ATR suggests increased market volatility, and traders should plan on how to trade the breakout accordingly.

In the BTCUSD 1-hour chart above, there was a market consolidation, which is observed by the ATR’s low values. The ATR indicator began to rise, indicating that a breakout was about to occur. After a few minutes, the price broke above its support level to rally significantly.
Position sizing
Using position sizing strategies, you should determine the correct number of units to buy or sell a currency pair. It’s one of the most crucial abilities a trader should have. Using the right lot size on different currency pairs can help you reduce risk and enhance your trading efficiency in the market. As a general guideline, high volatility currencies should be traded with smaller lot sizes, whereas low volatility currencies could be traded with bigger lot sizes.
Currency pairs with greater ATR values, such as the AUDJPY, AUDUSD, and CADJPY, may be traded with smaller lot sizes, whilst currencies with lower ATR values, such as the EURCHF, AUDCHF, and EURCAD pair, can be traded with larger lot sizes.
Identify a false breakout
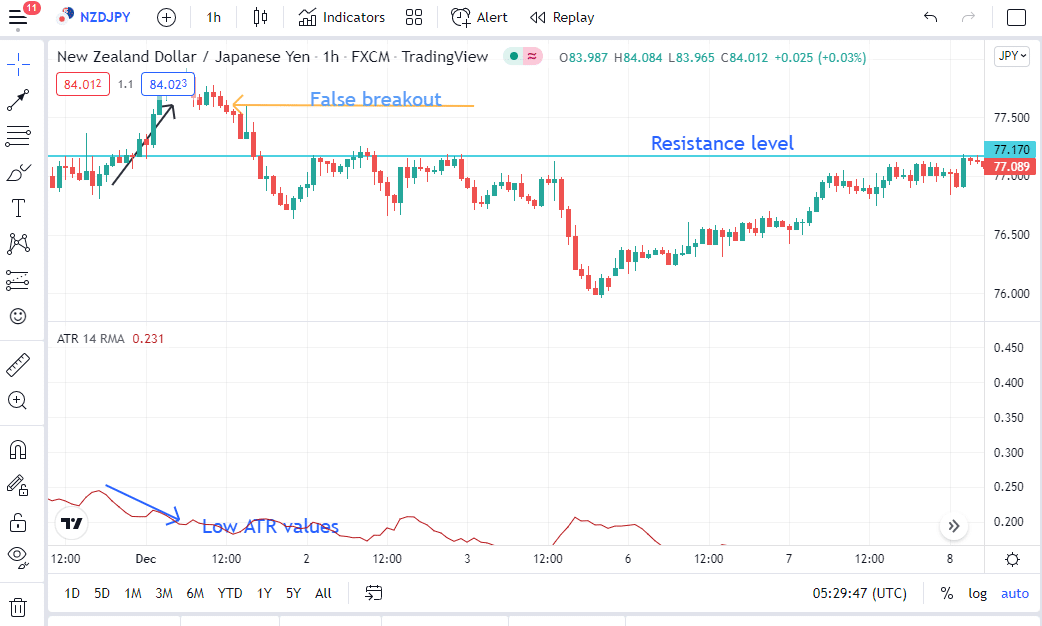
A false breakout occurs when the price temporarily breaks above (or below) a significant consolidation pattern, support or resistance level, previous swing high, or swing low, but then reverses direction. Most of the time, it’s only after the fact that you can determine if a breakout is legitimate or not.
Looking for a divergence signal between the ATR indicator and the price action is the first rule of trading false breakouts. A fake breakout, for example, occurs when a break below a support level is not followed by a rising ATR. When the ATR value remains low, it points to a likely false alarm.

In the NZDJPY chart above, there is a divergence signal between the ATR indicator and the price action. The price is rising while the indicator values are decreasing. The indicator has low values as well. In addition, the price has broken through the resistance line. This is an hourly chart, and all of these signals point to a fake breakout, which is quickly reversed after a few minutes.
Identifying buy and sell entries
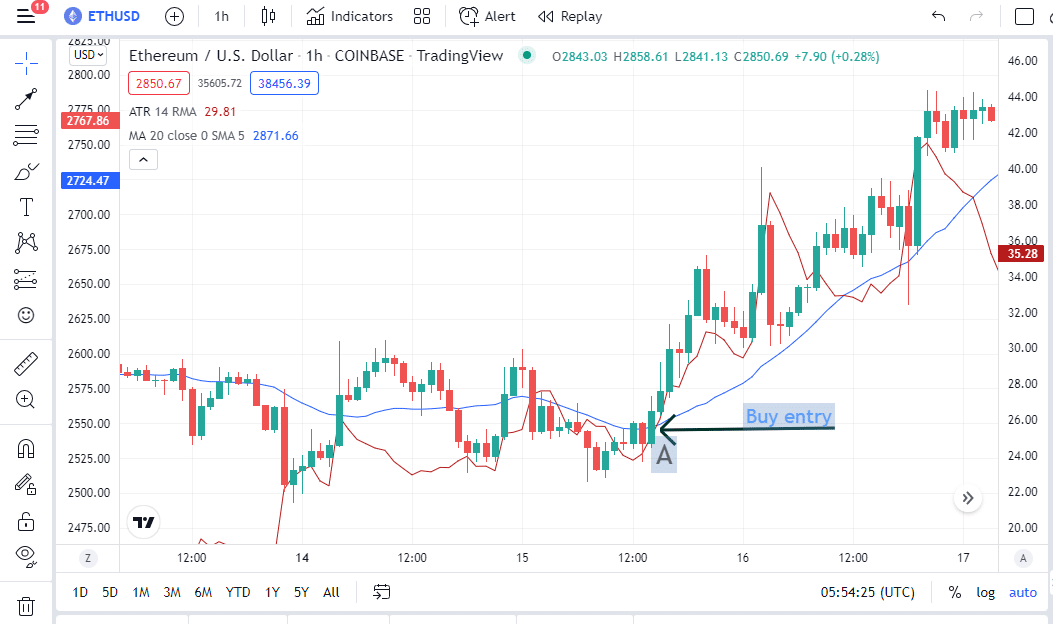
The ATR is simply a volatility indicator in a moving market, and it will not provide optimum entry points. Traders can fix this by drawing a signal line above the ATR. Traders can overlay a 20-period SMA over the ATR, for example, and watch for crosses. When prices are trending upward, an ATR cross above the signal line confirms an uptrend, allowing traders to place aggressive buy orders in the market. An ATR crossing below the signal line confirms a downtrend as prices fall, allowing traders to place sell orders in the market.

In the 1-hour ETHUSD chart above, we used the 20-period SMA as our signal line. The ATR crossed over the 20-period SMA in an uptrend in the section labeled A, indicating a buy entry.
Summary
The ATR is a price volatility indicator that may be used in both crypto and FX analysis. The indicator consists of a single moving line in a range. It can be calculated, and it’s included in much charting software. It can be used to identify real and false breakouts and help with entries and position sizing.