Speculative markets such as forex and crypto tend to be highly volatile sometimes, depending on the sentiment held by the various market participants. To that end, there are several tools that traders have developed over the years to help predict the direction of movement of these markets. One such tool is the moving average indicator, which was later improved to create the exponential moving average (EMA). This improvement was aimed at smoothing out some of the noise from irrelevant price spikes.
About the EMA
This is a variation of the moving average indicator that gives greater weight to the more recent prices. The simple moving average by default averages the prices over the last n periods, taking each price as bearing equal weight. By putting more emphasis on the most recent prices, the EMA achieves less lag than its older counterpart.
Be that as it may, both of these MAs are utilized in a similar manner. Whenever prices trend above them, traders see the market direction as bullish and will want to enter buy trades. In the same way, when prices trend below these averages, the market is seen as bearish and traders will fancy short trades.
How its calculated
The calculation of this indicator starts by obtaining a simple moving average. If you recall, we mentioned that it differs from the SMA in that it gives greater weighting to the most recent price values. To effect this in our calculation, we need to use a weighting multiplier. This is obtained using the formula:
K = (2/ (n + 1))
Where n is the number of periods.
Once we obtain this multiplier, we can calculate the EMA using the formula:
EMA = A + (K * (B – A))
Where:
A is the current closing price
B is the EMA of the previous period. For the first period’s EMA, we use the SMA.
K is the weighting multiplier.
This calculation results in a moving average that’s a much smoother line, and one that also tracks prices more closely than the SMA. Due to this, it has better accuracy than the latter average. However, this increased sensitivity to prices may be confusing, especially in periods of high volatility. For that reason, it is always wise to combine this tool with other complementary indicators.
Pros and cons of the EMA
Pros
- It is more accurate than the SMA as it puts more emphasis on recent prices.
- It is especially useful when identifying the prevailing market trend.
- It can be used as a dynamic support or resistance.
- By observing the gap between itself and prices, EMA can be used to identify potential reversals. The larger the gap, the higher the chances of a reversal being imminent.
- It is easy to use with other indicators like the RSI, MACD and ADX.
- Can be used to form golden and death crosses using the 50 and 200 period SMA. This strategy gives insight into both short-term and long-term market sentiment.
Cons
- It is not always accurate as a standalone indicator.
- Though greatly reduced, it still features some lag.
- It can provide false signals during volatile market conditions.
Trading strategy using the EMA.
The strategy we shall discuss herein below is suitable for both the forex and crypto markets. It is a three-pronged approach that has posted successful results in the past.
Step 1: Finding the trend.
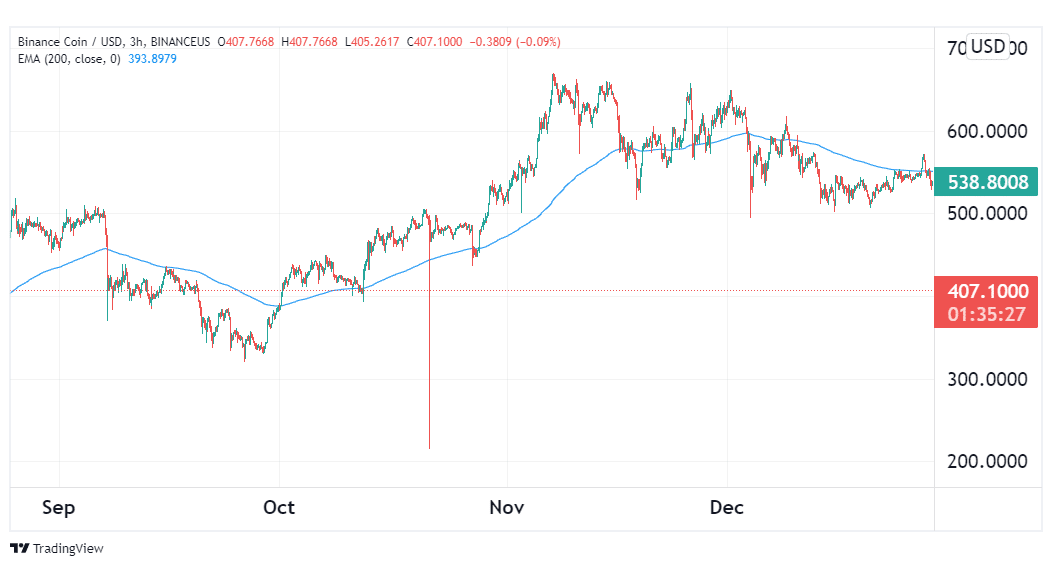
We can use the EMA to find the overall market trend, which helps provide us with a trading bias. To do this, we shall utilize the 200-period EMA, and check whether prices are trending above or below it. If above, we will be looking to enter long trades and if below, our bias will be towards short trades.
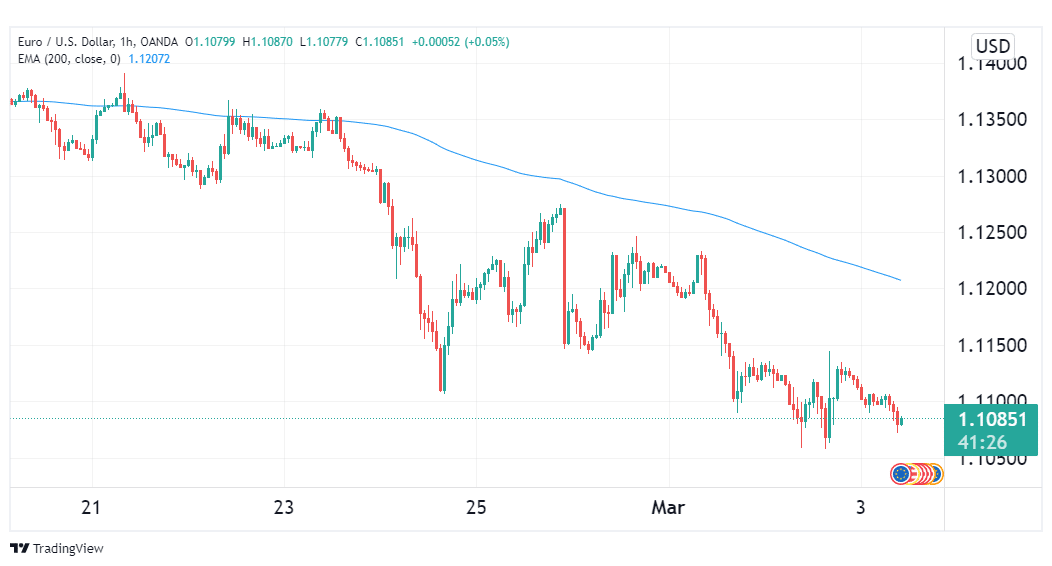
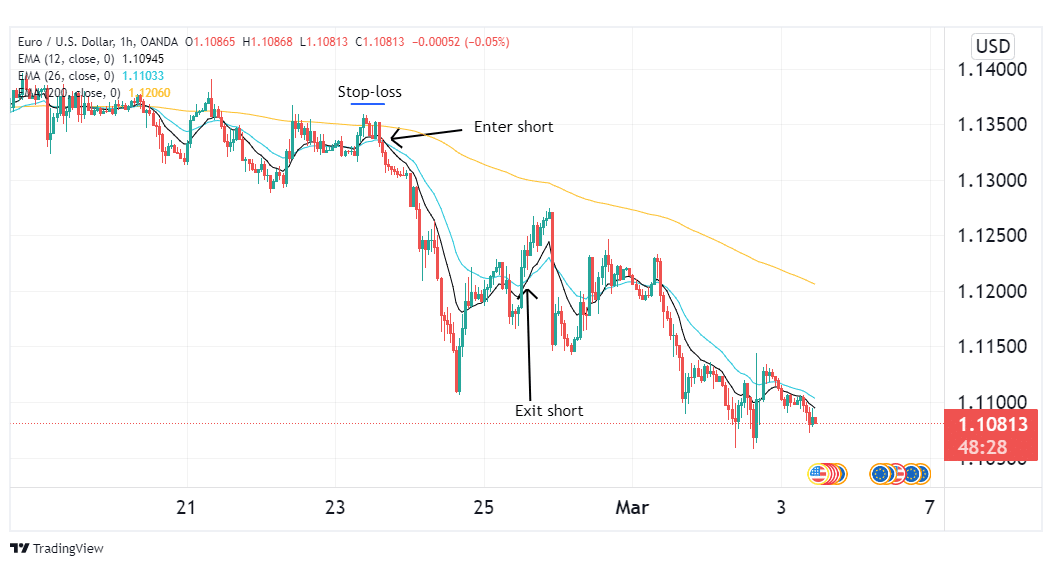
From the illustration above, we can see the EURUSD pair was in an overall bearish trend as evidenced by prices below the 200-period EMA. For that reason, we will be looking to short the pair whenever the chance presents itself.
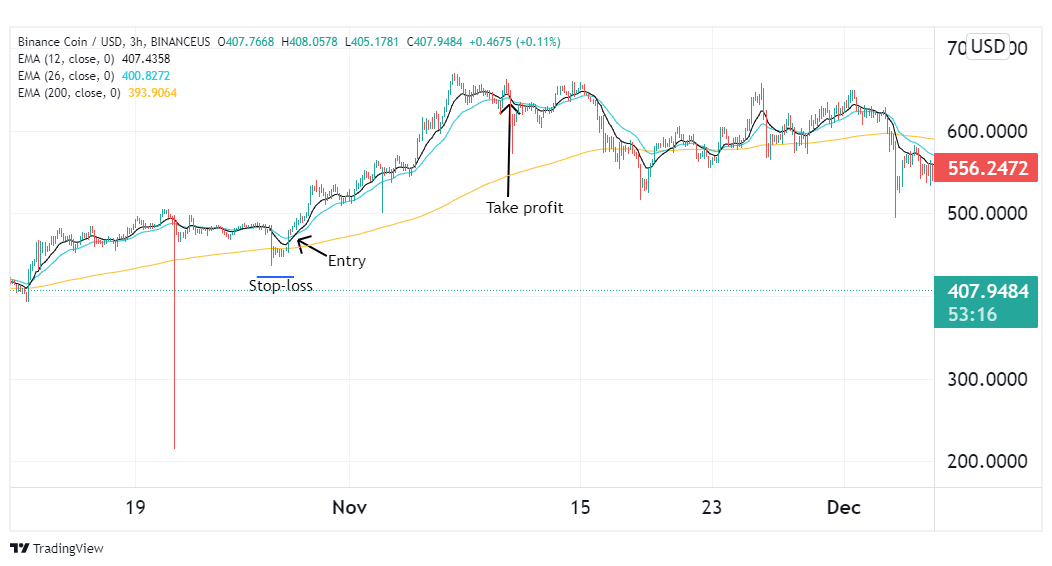
Shifting focus to crypto, the figure below shows BNB being bullish from October till the beginning of December. Any trades during that period would preferably be long trades.
Step 2: Finding suitable entries.
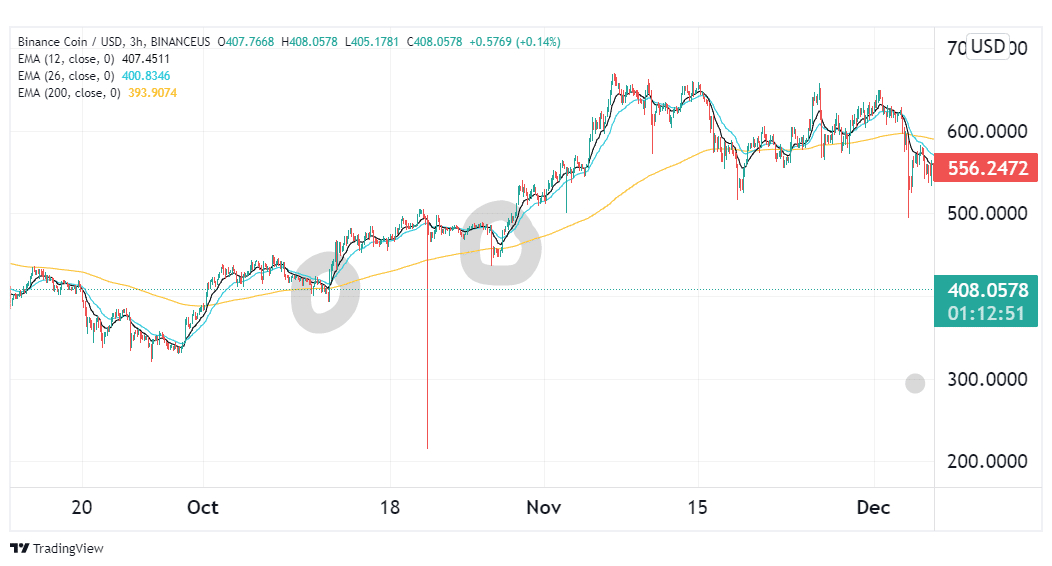
Once our trading bias is established, we can use two EMAs to identify suitable entries into the market. Our recommendation is the 12 and 26 period EMAs. For a long trade bias, we will enter buy trades when the 12-period EMA crosses above the 26-period. For a short-trade bias, we will enter trades when the 12 period goes below its longer counterpart.
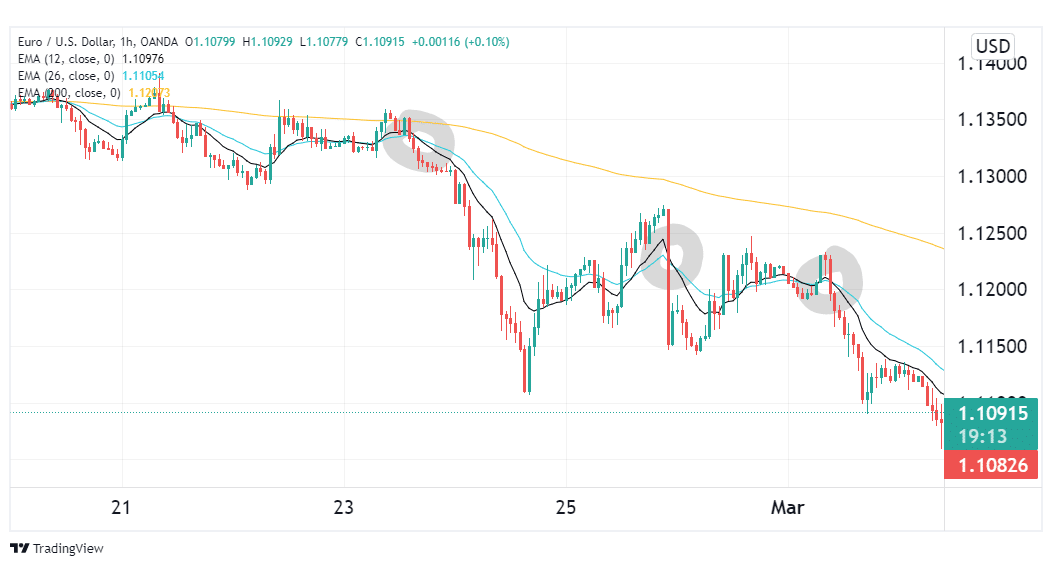
In the image above, opportune entries marked by the crossing of the 12 and 26 period EMAs are highlighted in black. Each of these three positions would have been ideal to short the pair.
Switching to crypto, the image below shows BNB entries highlighted by the 12 period EMA crossing above the 26-period.
Step 3: Timing exits.
You may opt to place your exits following a suitable risk to reward ratio. However, the EMA can also be used to serve this purpose. In an uptrend, a suitable exit would be when the 12-period EMA crosses back below the 26-period. When trading downtrends, the exit will be marked when the 12-period EMA crosses above its longer counterpart. Additionally, you should place stop losses at previous swing lows or swing highs from your entry position. This is illustrated in the figures below.
Summary
The exponential moving average is an improvement of the SMA that features less lag and greater price sensitivity. It is suited for several financial markets, among them forex and crypto. Though a superior MA in its own right, it is best utilized in combination with complementary indicators.