It’s rare to find an indicator that can tell you both the direction and the momentum/strength of a trend at the same time. However, the MACD indicator is a rare case because it can tell you both of these factors at once.
How the indicator works
We employ histograms in MACD trading methods for the purpose of plotting the difference between a MACD line and a signal line. These two lines are derivatives of Exponential Moving Averages (EMAs). The indicator line moves up and down in relation to a zero line, which is also referred to as the centerline. In order to calculate the MACD, one must subtract the shorter MA from the longer MA. The MACD is not complete without a signal line, which represents its EMA.
We divide the 12-period EMA by a 26-day EMA to get MACD. Also, there’s the signal line, which is a 9-period EMA. The histogram shows points of convergence and those of divergence of these lines, which can help traders determine how strong a particular trend is. In an uptrend, the EMAs diverge, and in a downtrend, they come back and converge when the trend slows.
MACD strategies
Signal line crossover
You should pay attention to this signal because it is the most fundamental one. As we have seen above, the signal line depicts the MACD line’s Moving Average. This is the reason why it consistently falls behind. These two lines’ intersections signal significant shifts as below:
- Bullish crossover occurs when the short-period EMA crosses over the long-period EMA.
- Bearish crossover results when the short-period EMA drops below the long-period EMA.
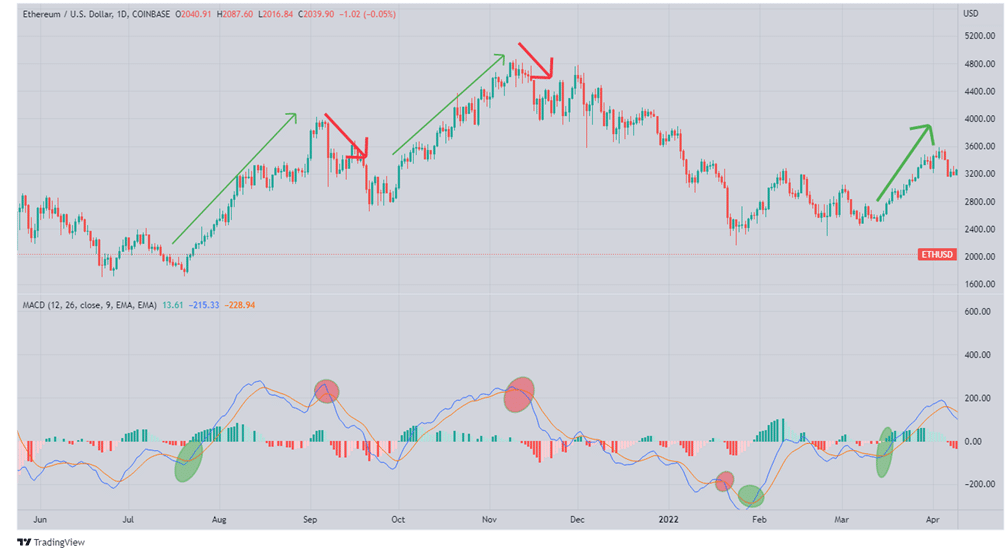
The green highlights indicate buy signals and the red highlights indicate sell signals on the chart above.
The crossover at the zero line
To amplify the signal, keep an eye out for the overall trend. In the event that it coincides with the crossover, we get a more reliable signal.
In this case, the indicator line will cross the zero level rather than the signal line. When it rises over zero, it indicates a strong bullish trend. Similarly, when it goes below the zero line, it communicates impending bearishness.
Often, such crossovers can send false signals, and traders need to be aware of this. Also, this strategy is relatively slow-paced and you will notice fewer signals. This implies that in the extremely volatile crypto markets, it is possible that you will receive your signal too late for it to be of any value.
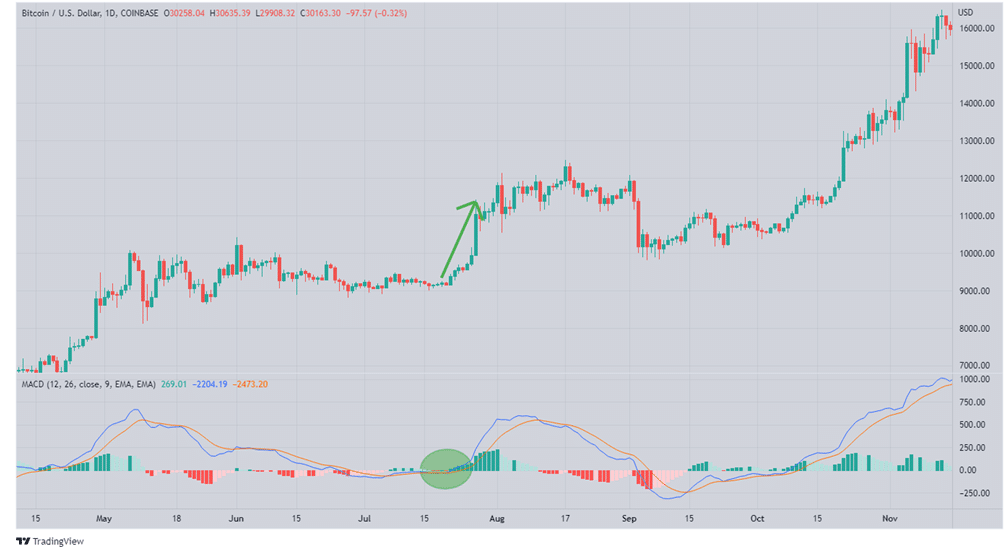
However, although this method has a reduced chance of resulting in a false reversal, it can be extremely useful for making longer-term market moves.
MACD in corrections
MACD can help traders trade pullbacks. As price moves back up in an uptrend, the indicator line dips to the signal line, but then bounces back off it. This hook-shaped configuration may provide a nice entry point.
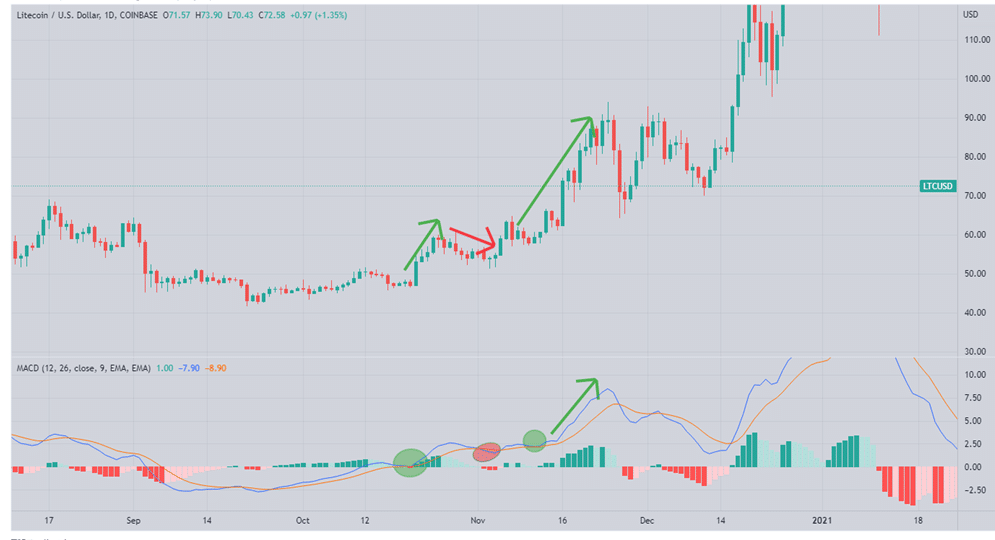
The illustration above shows that LTC broke above the centerline, which is a buy signal. Nevertheless, as the upward movement came to a halt (red arrow), the MACD plummeted almost all the way to the signal line (red highlight). However, it didn’t break below it. The MACD started to trend higher again afterwards before the price started to rebound.
Traders who had missed the opportunity to buy the cross above the centerline now had an opportunity to do so at the pullback. A sell signal came in at exactly the time that the LTCUSD pair started trading downwards.
Divergences
When the crypto price moves in a particular direction and the MACD indicator follows an opposite trajectory, we get a divergence. This is a signal to traders that a trend reversal or a rise or fall in the price is about to occur.
Bearish divergence: This takes place when a coin’s price reaches a new high. Meanwhile, the MACD line does not confirm the price. Instead, it reaches a lower high. This is an indication that coin prices may be on their way down since the rally is losing steam. After a sustained upward trend, a bearish divergence between price and time on the indicator line creates a strong signal to sell.
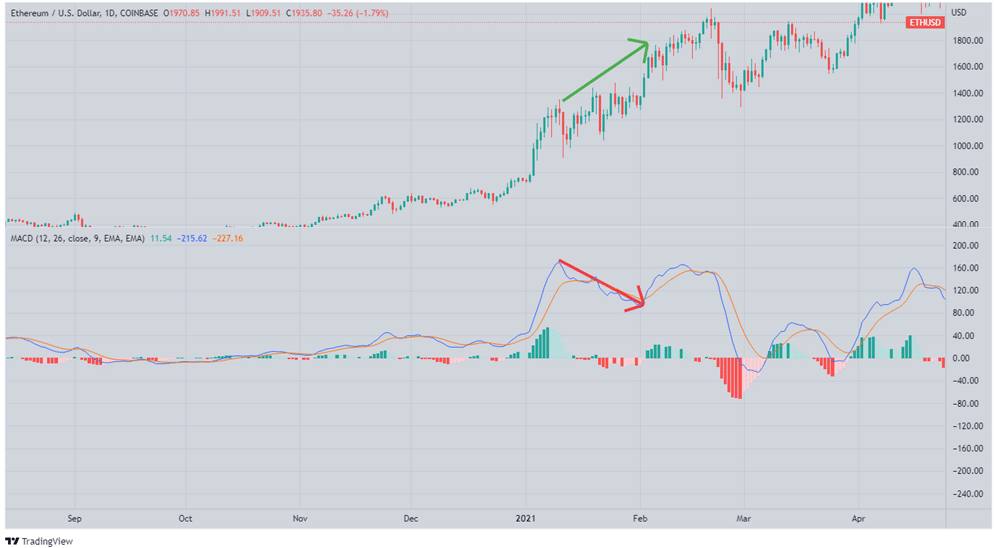
The MACD indicator formed a bearish divergence while ETHUSD price continued to achieve higher highs on the above chart. This signaled that the momentum was weakening. Under such circumstances, traders should exercise caution and stay away from long positions. In this instance, the long-term bearish divergence ended in a big drop.
Bullish divergence: It takes place when an asset’s price drops and the indicator does not confirm that price by making a higher low. This signals the weakening of the selling pressure and it shows an imminent price upsurge. In a downward trend, a divergence in the MACD creates the perfect opportunity for a buy signal to reverse direction.
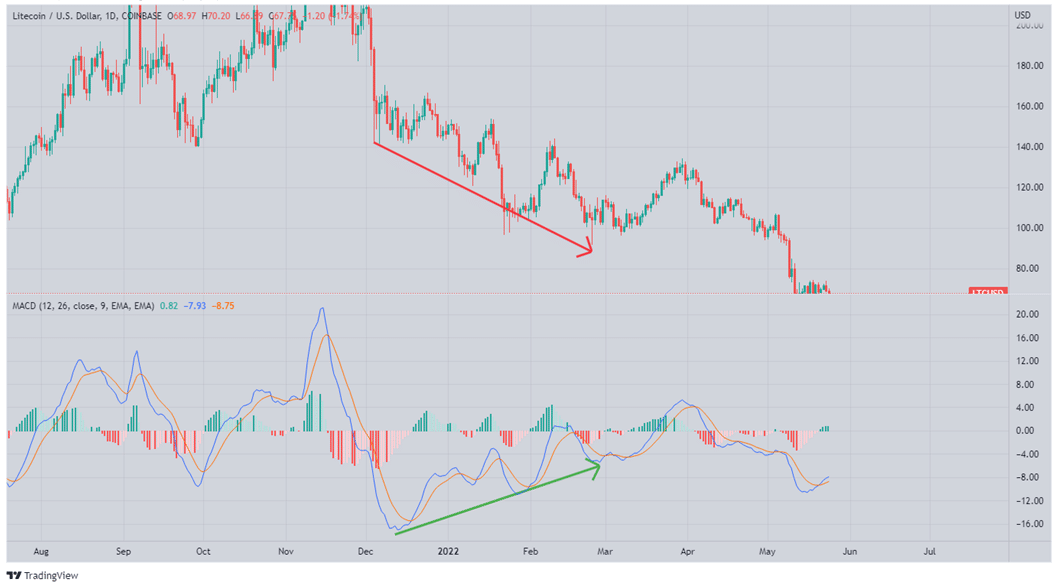
Litecoin’s MACD generated a positive divergence during a significant downtrend, as can be seen in the chart above. Traders that purchased the crossover over the centerline were likely whipsawed. In other words, you should delay trading divergences until the price action indicates a change in trend.
In summary
With the MACD indicator, you may measure an asset’s momentum as well as its direction.It is an all-in-one indicator that simplifies charts and provides a clearer picture of the market’s movement. However, the crypto market is quite dynamic and you should look for alternative signs and never rely exclusively on just the MACD alone to make your trading decisions.