The world of technical analysis is home to an array of indicators that traders rely on to gain an edge on the price prediction.
Different tools stand out due to their ability to reduce lag, eliminate noise, and, most importantly, respond to market changes. However, most of them are dependent on historical data rather than the most recent ones, thus struggling to respond adequately to changes in market sentiments in a timely manner.
Hull Moving Average (HMA) is one indicator that provides timely insight into the prevailing market sentiment. The Moving Average (MA) stands out from other MA’s partly because its readings depend on slim margins with price movements.
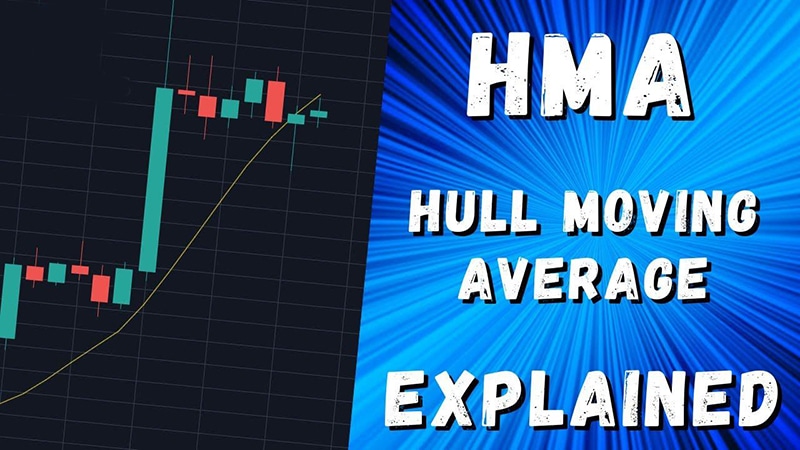
In addition, it relies on the recent price changes instead of the older ones used by other MAs. Therefore, its readings tend to be much smoother and more dynamic to the slightest changes in market momentum. Consequently, it allows technical analysts to know what is happening in real-time based on the smallest changes in sentiments.
Understanding HMA
The HMA tool is commonly used to ascertain entry and exit points given its ability it minimizes lag synonymous with traditional MA’s. Its ability to retain the MA line’s smoothness makes it easy to pinpoint the ideal level to open or close a position. It can also reduce lag by using Weighted Moving Averages to prioritize the most recent data.
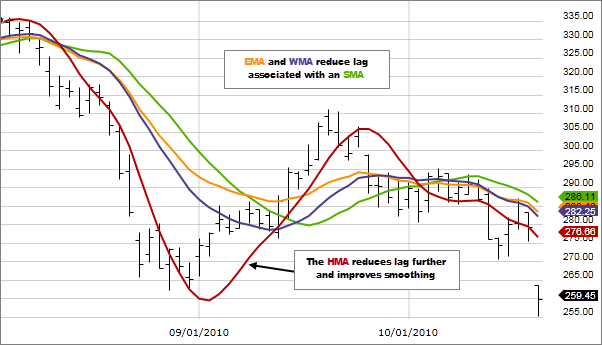
The chart above shows the use of HMA hand in hand with a Simple and Exponential Moving Average. It is clear from the chart above that HMA is extremely fast and smooth compared to the other moving average. In this case, it changes direction as soon as market momentum shifts and price starts to move up.
In contrast, the SMA and EMA indicators continue to edge lower for some time before correcting and moving up in line with price movement.
How does it work?
The directional trend indicator finds great use in capturing the most recent market dynamics. Therefore, it can determine prevailing bullish or bearish sentiments by relying on the most recent data.
While using the HMA in Bitcoin and forex trading, it is important to deploy it in the best time frames. When carrying out technical analysis using long-period time frames such as daily or weekly charts, the indicator will come in hand in determining the prevailing trend, either long or short.
The HMA can also be deployed in shorter periods whenever one wants to determine the ideal entry or exit points. In a shorter period, it makes it easy to capture price movements as they occur in real-time.
The tool also works best when used to determine the direction the market is moving rather than relying on crossovers. Crossovers often come with a lag as one must wait for a fast-moving MA to rise above the slow-moving MA rather than paying attention to price movement.
HMA trading strategies
A longer period HMA is commonly used to identify the prevailing trend while trading Bitcoin or currency pairs in the forex market. Whenever the indicator is rising, it implies the market momentum is to the upside and that bulls have the upper hand compared to short sellers. Consequently, people use this opportunity to only eye long positions on pullbacks to the indicator.
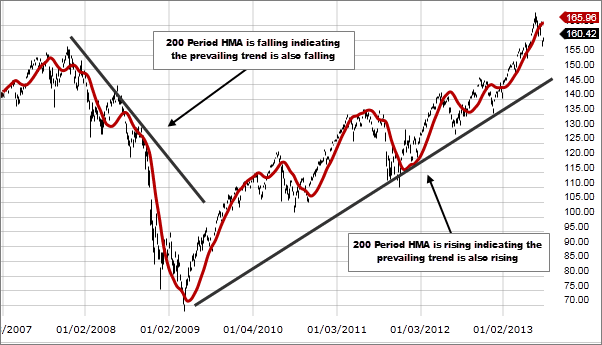
Similarly, if the indicator is moving lower, it implies strong bearish pressure in the market. Likewise, technical analysts use this opportunity to eye sell positions on a small bounce back to the HMA. The prospects of price edging lower on small bounce backs is usually high whenever the tool is edging lower, making lower lows.
Defining entry points
Short-term Hull Moving Averages are commonly used to define the ideal entry points while trading Bitcoin or the broader forex market. For instance, a buy signal will come into play whenever the HMA turns up from moving lower and starts registering higher lows.
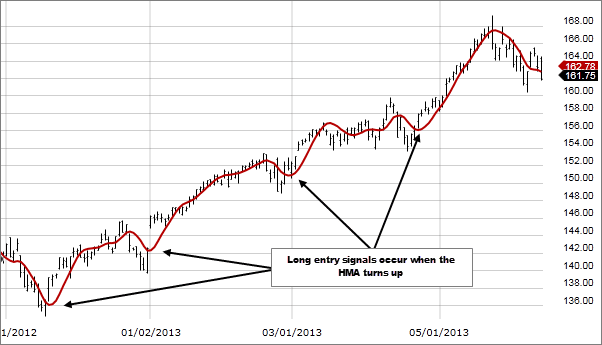
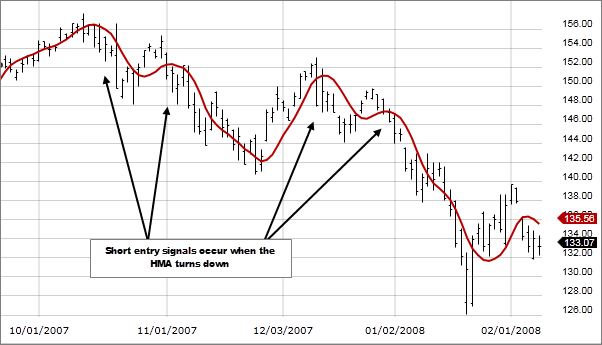
A short or sell signal arises whenever the HMA reverses from moving up and starts moving lower. The same implies a buildup in selling pressure with short sellers in control.
HMA competitive edge
The Hull Moving Average operates the same way as traditional MA. However, it boasts one competitive edge that makes it stand out in the technical analysis. Its ability to isolate market noise and shrug off lag addresses some of the biggest flaws of traditional MA’s.
Consequently, HMA responds to price changes quicker, allowing traders to identify a trend as soon as it starts to form. Entering trades as soon as a market reverses allows participants to lock in as many profits as possible before a reversal occurs. HMA fast signal and the smooth visual line are unmatched in the segment.
In addition, the indicator can be tailored to any duration depending on what one wants to achieve in analysis. In this case, one can alter how far back it can look into price history when analyzing market conditions.
Final thoughts
The Hull Moving Average is an effective technical analysis tool for anyone who wants to have an edge in identifying a trend and a reversal. In addition, it makes it easier to identify the ideal entry and exit points regardless of the security one is trading as it pays more emphasis to the most recent data, which affirms prevailing market sentiments.
The tool finds great use in day trading, given its ability to respond to the slightest of price changes while shrugging off the noise. While the indicator is effective, it should never be used in isolation. It is best practice to use other indicators such as the Relative Strength Index or Average True Range in combination with the HMA for the best outcomes.