There are a few forex indicators that indicate momentum, new trends and cyclical conditions that traders can use to analyze the market. But if you’re looking to identify overbought and oversold levels with a trend strength indicator, there is no indicator like the Commodity Channel Index.
In this article, we explain Commodity Channel Index, how it can be useful for traders, and what some of the basic strategies are.
What is the Commodity Channel Index?
The Commodity Channel Index(CCI) is used to highlight cyclical trends in a security. Though it is an oscillator that wavers below and above the zero line, it is mainly a momentum indicator since there are no limits to its values.
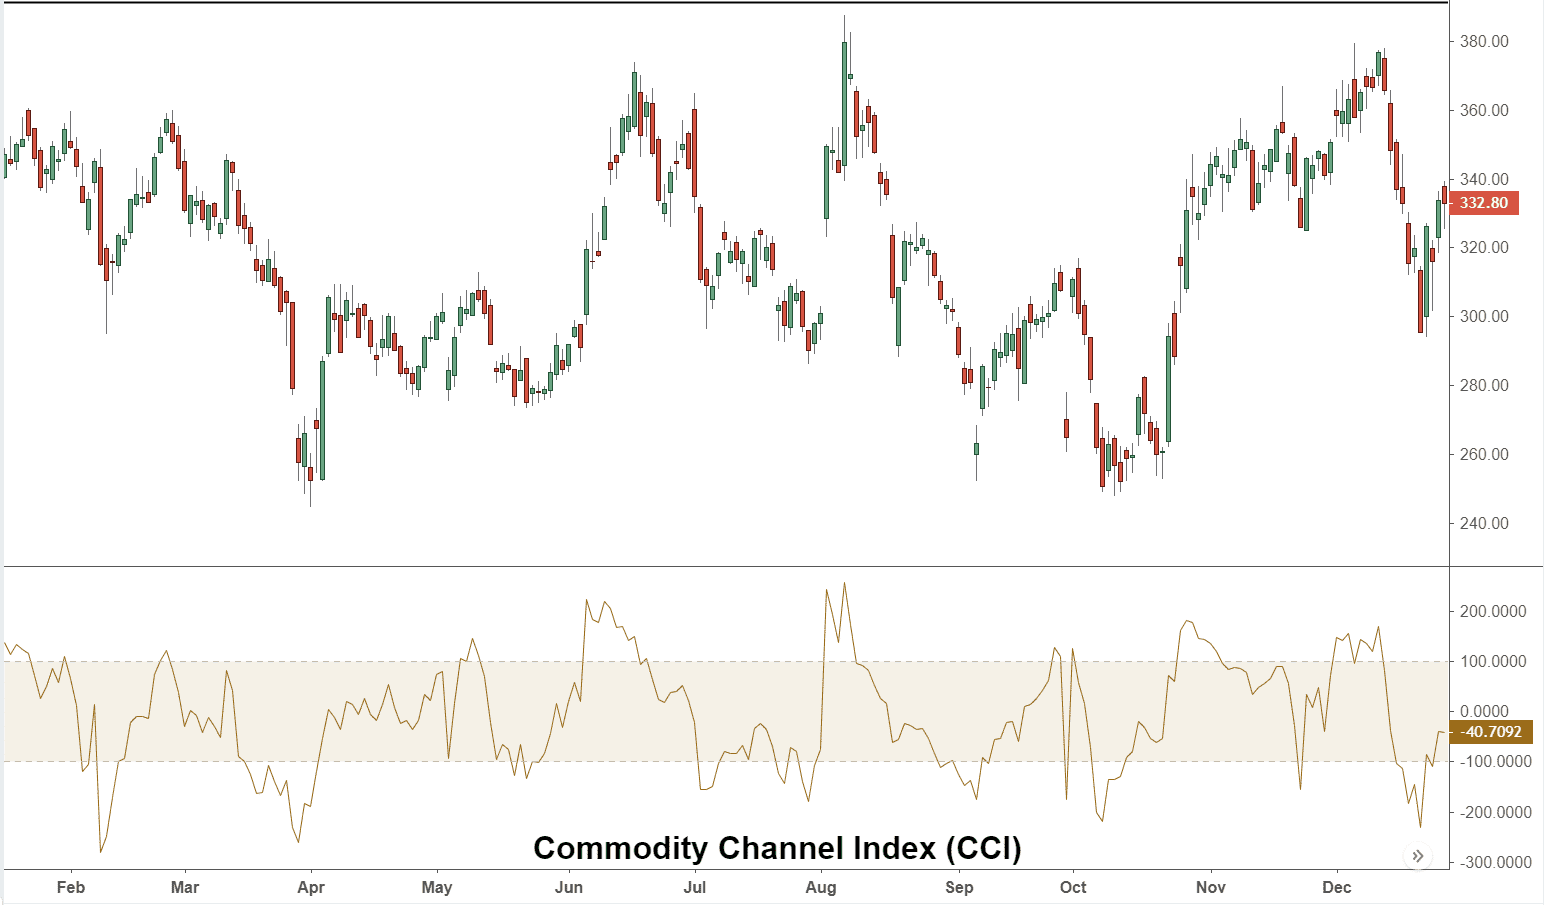
CCI helps to determine when an investment vehicle is moving to a condition of being oversold or overbought. It indicates and assesses the price trend direction and its strength. Such information allows traders to know if they should enter or exit a trade, add to an existing position, or be wary of taking a trade.
Put another way, CCI measures an asset’s value divergence from its statistical average. For calculation purposes, take the commodity’s ‘typical price’ (TP), subtracting the average typical price (ATP), and then divide the value by the mean absolute deviation (MAD).
In order to make the values intelligible, they are multiplied by 66.67 or (1/0.015). As such, more than three-fourth of the values fall between -100 and +100. CCI highlights:
- Beginning of a strong uptrend when it moves above +100.
- Beginning of a strong downtrend when it moves below -100.
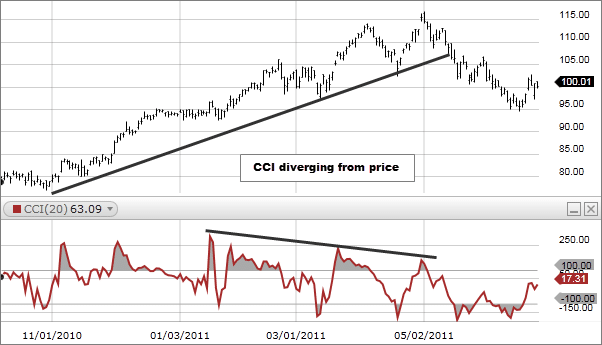
- Price reversal if the underlying prices are making a new high or low that is not confirmed.
History of Commodity Channel Index
Donald Lambert is accredited with the introduction of the Commodity Channel Index in 1980. As a technical analyst, he published about the CCI in the magazine Commodities, which is now known as Futures.
It was namedthus since it was used originally to analyze commodities. Ever since its introduction, CCI has become quite popular and is now a common tool for traders as it identifies cyclical trends in equities and currencies as it does in commodities.
The basic assumption behind this indicator is that commodities basically move in cycles. That means their highs and lows occur at periodic intervals. Donald Lambert suggested using one-third of a cycle as the time frame for the CCI. For instance, if the cycle runs for 60 days, then a 20-day CCI is recommended.
How Commodity Channel Index can be adjusted and how is it useful for traders
Although Commodity Channel Index was developed to find long-term trend changes, it has been adapted by traders for use on all timeframes. There are more buy and sell signals for traders when they trade with multiple timeframes. Many times,traders use CCI on the longer-period chart in order to determine the dominant trend and on the short-period chart to generate trade signals and pullbacks.
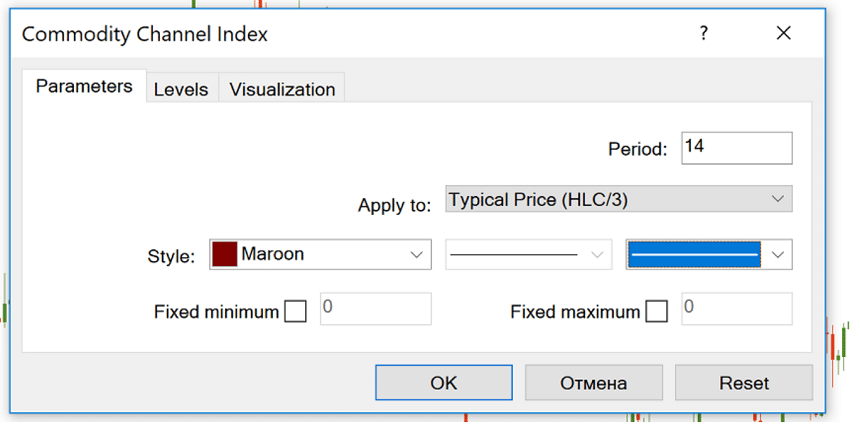
A period describes the number of price bars the CCI will have in its calculations. It can be monthly, weekly, daily, five-minute, one-minute, or any time frame that is available on the chart.
Although almost 75% of the values fall between -100 and +100, a full quarter of the values fall outside the range. This highlights a lot of strength or weakness in the price movement.
With longer periods, the trade values do not go outside the -100 and +100 band too frequently. Some traders favor the shorter period as it helps to generate more signals. On the other hand, long-term traders prefer a lengthier period. As such, it is advisable for short term traders that they utilize the indicator charts with an hourly or minute by minute basis, while daily and weekly charts are for long-term traders.
Basic Strategies using Commodity Channel Index
One basic strategy involves tracking the CCI for any movement above +100 as this will generate buy signals while movements below -100 will create sell or short signals. Investors should only look to take the buy signals. On the other hand, as the sell signals occur, they should exit, and invest again when the buy signal reappears.
The Commodity Channel Index can also be used on multiple timeframes. As mentioned above, long-period charts are used to determine the dominant trend, while short-period trend establish pullbacks and entry points. Active traders tend to use multiple timeframe strategy. But these can be used for day trading as well since ‘long-term’ and ‘short-term’ are relative to how long traders want their positions to last.
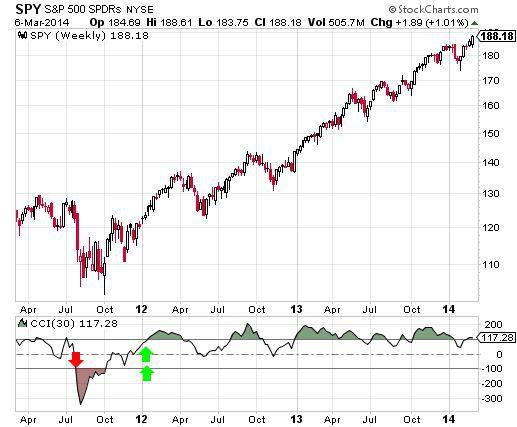
The figure above shows a weekly upwards trend since 2012. If this is a trader’s long-term chart, he should take only the buy signals on the short-term chart.
While using a daily chart for the short timeframe, more often than not traders buy as the CCI goes below -100 and then climbs up over +100. It is better to exit the trade as the CCI moves beyond +100 and then drops below +100. Conversely, as the trend on the long-term CCI goes down, it highlights a sell signal to exit.
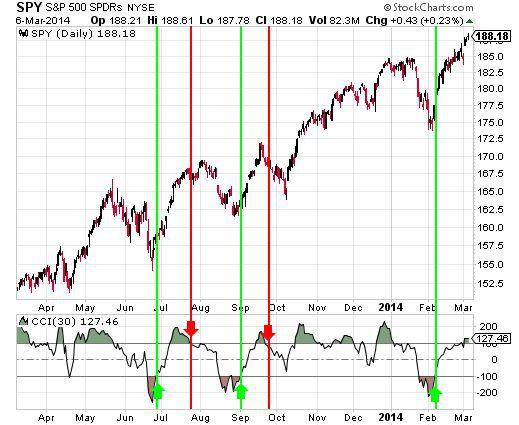
In the figure above, there are buy signals and two sell signals on the daily chart. As the CCI on the long-term highlights an uptrend, no short trades are initiated.
On the longer-term chart when the CCI is under -100, take only the short sale signals on the short-term chart. This is because a downtrend is in effect until the long-term CCI goes above +100. The figure also highlights that when the CCI goes above +100 and then drops below +100 on short-term chart, you should go with a short trade.
As the CCI moves below -100 and then goes back over +100, traders should exit the short trade. Conversely, traders should exit all short positions when there is an uptrend on the long-term CCI.
Traders can use CCI to adjust the rules and make the strategy either more strict or lenient. Similarly, traders also adjust the rules for entry and exit, especially when on the short period timeframe.
The unfortunate thing about CCI is that when conditions turn choppy, it is likely to produce multiple false signals. It can also fluctuate across signal levels, thereby resulting in ambiguous short-term direction or losses. In such conditions, always trust the first signal if the long-period chart confirms the entry direction.
Although the strategy does not include a stop-loss, it is advisable that traders have a built-in cap for risks to some extent. When buying, it can be placed under recent swing low; while shorting, it can be placed over recent swing high.
The Bottom Line
Commodity Channel Index is a versatile indicator that is used to identify trend reversals or overbought and oversold levels. The latter extreme depends on the characteristics of the historical range and underlying security of the CCI.
Volatile securities are more likely to need greater extremes than docile ones. A trend change is highlighted when the CCI goes past specific thresholds between 0 and 100. Regardless of how it is used, Traders and chartists should utilize CCI in conjunction with other indicators.