Triple tops, as the name suggests, are price patterns comprising three minor highs. These three price positions are of the same price length.
A short-term bearish reversal mainly follows the trading pattern. In contrast, double tops are two price peak points that are formed close to each other.
Like triple tops, double tops are also followed by a short-term bearish reversal. There are a few differences between these two formations, as can be viewed in a trading platform.
Identity guidelines
1. Bump and top-shape formations
Triple tops have similar or near-similar price-level formations as well as the size of the bumps. On their part, double tops can either be wide on both ends (Eve/Eve), one narrow, the other wide (Adam/Eve), or both narrow (Adam/Adam).
2. Price formations
Triple tops have larger price formations as compared to double tops. There are pullbacks between the three bumps before the reversal takes place.
3. Weekly vs. daily formations
Since longer formations have better performance than shorter ones, the trader will do well to use weekly formations before reverting to daily patterns. In addition, if the bumps of the triple top are not large enough, the pattern will, in turn, lead to a bullish reversal.
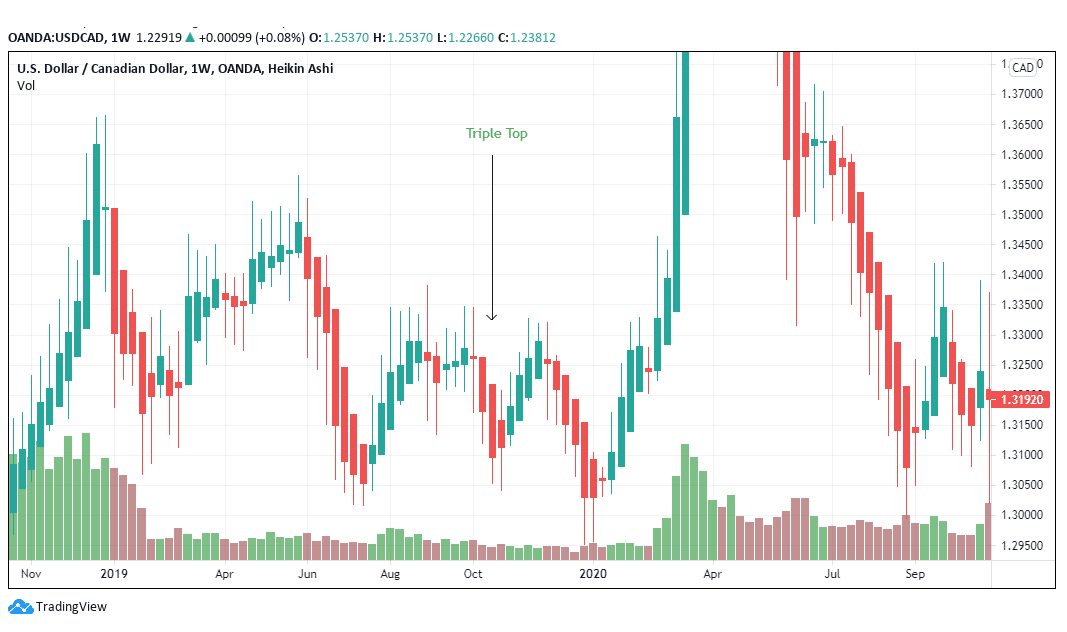
For example, in figure 1, the triple top formation started first from a bearish turn. This aspect contrasts with double tops that first begin from a bullish run or a rally in prices.
The bumps in the triple top are also short and form an incomplete pattern. Short bumps are recipes for bullish reversals as compared to bearish continuations. When the minor high begins from a low prior price point, the pattern is likely to take a continuous turn.

Figure 1: Weekly Formation of the USD/CAD trading pair
A double top will begin from an uptrend in prices, unlike a triple top that can also begin from a downtrend (as seen in figure 1).

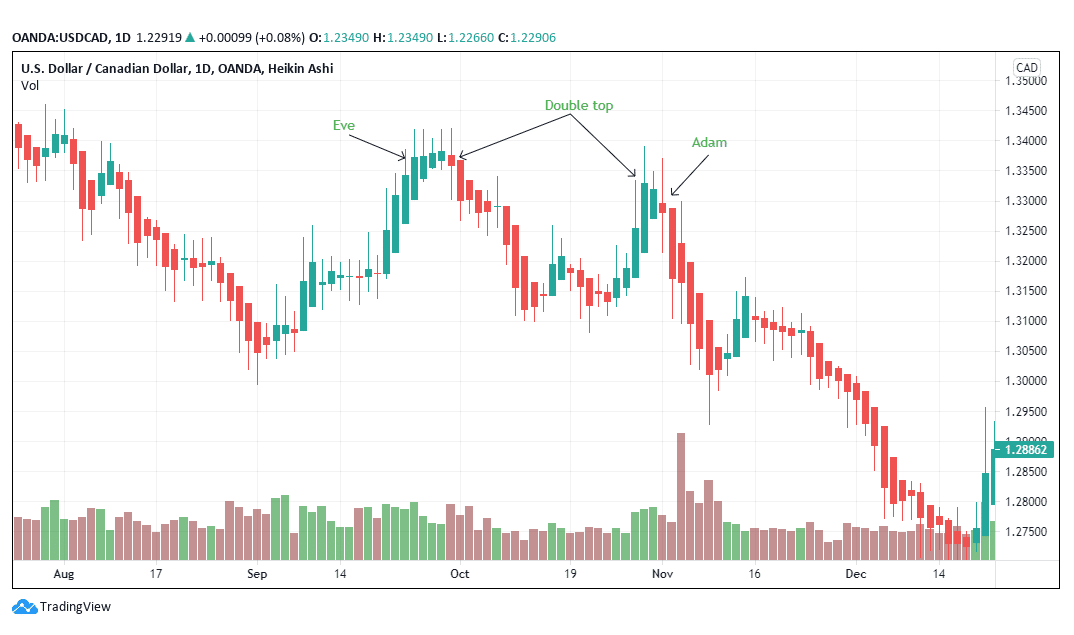
Figure 2: Double top on the USD/CAD trading pair
The first bump (Eve) in the double top is wide with a fluctuating volume pattern. The second bump (Adam) looks like an inverted V-shape. A tall valley between Eve and Adam indicates a better performance.
A look at figure 2 will show that the bearish reversal occurs immediately after the right bump forms.
The short retracement from mid-November is quickly overtaken by the bearish trend that continues past mid-December 2020.
The double top is also visible in the daily chart compared to the triple top that appears in the weekly chart. However, this assertion does not stipulate that the triple top only appears in a weekly chart. Some situations occur in a daily chart as well.
4. Bump/ peak separation
In a double top, the two bumps are separated by more than two weeks. While the separation can last for as long as six weeks, tops that are differentiated by up to five weeks have weak performance.
In figure 2, the left peak in the double top ends on September 28, 2020, while the right top ended on October 26, 2020. The difference between these two tops is almost four weeks. The bearish reversal took place on November 2, 2020, at 1.3223 until it reached a low of 1.2761 on December 14, 2020. The decline here is 3.5%.

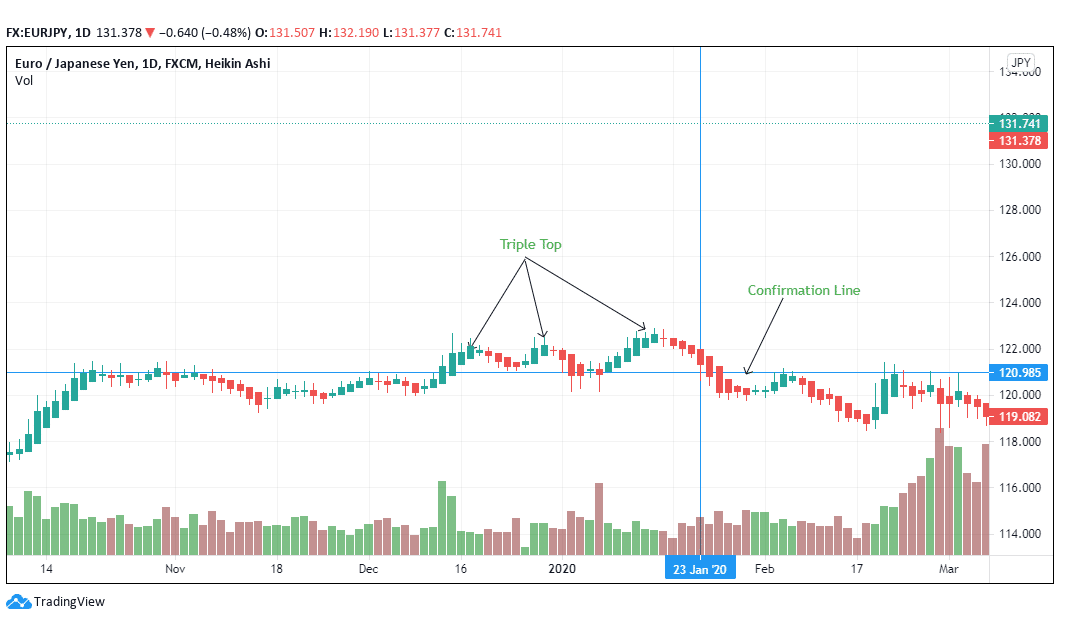
Figure 3: Triple top in a EUR/JPY trading pair
In the triple top formation, the bullish reversal occurs from January 20, 2020, at 1.3048 to 1.4112 on April 6, 2020 (+8.15%).
5. Confirmation line
In a triple top, the trader should wait until the confirmation line forms after the third peak/ minor high.
Prices will then decline in the intermediate term with a short pause at the confirmation line (see figure 3). A look at the triple top shows that prices do not decline steeply after hitting the confirmation line.
The confirmation line in figure 3 occurs at 120.985 for the EUR/JPY trading pair. Prices oscillate in an up and down movement until they settle at 119.082 (-1.57%).
The double top takes an extreme turn after hitting the confirmation line. There is a moderate price decrease between the two peaks.
Here the confirmation line acts as the resistance point. In figure 2, prices do not rise close to the resistance line. In the triple top, prices may rise and touch the resistance line as the trading pattern moves along.
Trading strategy
1. Compute the price target
Measure the height of the triple and double top. Get the price of the minor high (in both top patterns) and subtract it with the lowest retracement. Subtract this difference to the confirmation line to see how far down the price will decline. This measurement is essential when placing the stop-loss order.
2. Replace long positions with short takes
In trading, both triple and double tops are composed of price peaks and retracements. For triple tops, the retracements are more than the double tops, and price movements are subtle. A trader will exit long positions after spotting the topping patterns and replace them with short positions.
However, in a double top, the trader can afford to take long positions and take up more profits as compared to a triple top pattern. In figure 2, prices have declined from 1.3250 to 1.2750 (-3.77%).
In a triple top, the trader should short (or sell) the EUR/JPY pair after the pair’s price goes lower than the retracement lows. In the case of figure 3, sell when the price moves below 120.985. You can draw the trend line or use a horizontal line.
3. Use a stop-loss
Place the stop-loss order between 10-20 pips above the entry point. Ensure you take note of any swing positions and any trades conducted in the past. This analysis helps to check the trend of the trades and likely movements expected from the trade. Move the stop-loss depending on the price action.