Modern trading relies on complicated market analysis by using various nonlinear technical indicators that rely on complex mathematics, econometrics, and artificial intelligence. However, even as the amount of pre-installed forex indicators packages increase in trading terminals, various elements of old technical analysis continue to bring traders money.
One of them is Donchian Channels, which we will go through today. It is one of those ‘old formulas’ that simplify the principles that impact the price movement – demand, supply, and psychology. Such a trend strength indicator must be learned by every trader.
What are Donchian Channels

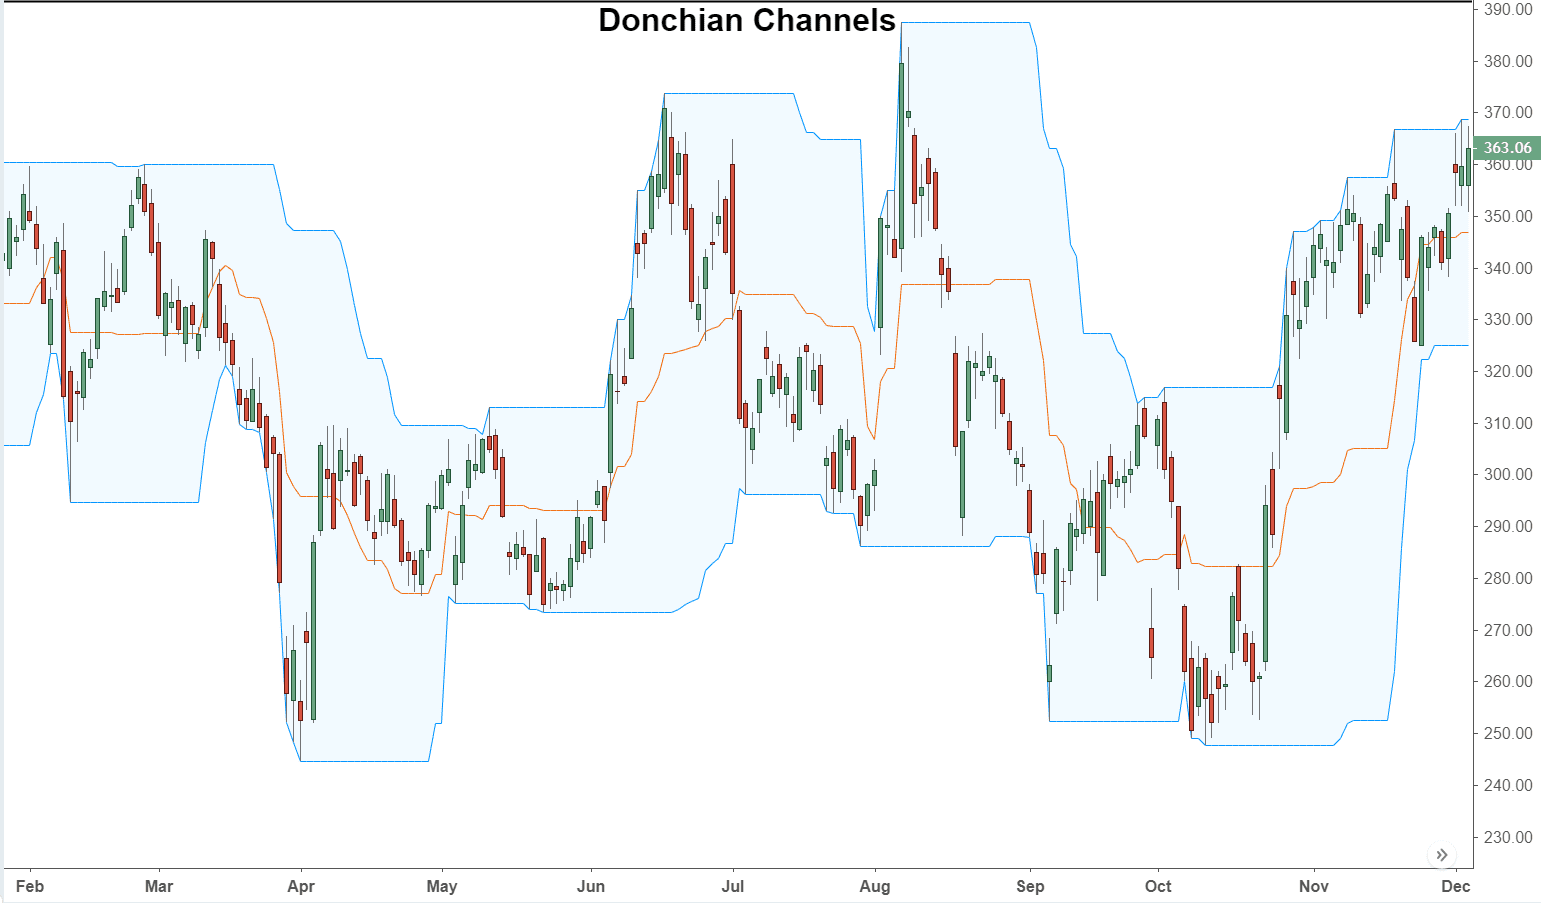
Donchian Channels assess market volatility. It plots a line over a period of time at the high and low price of an asset. Candlesticks are plot areas that are used as a timepiece to demonstrate open, high, low, close price, and timeframe of a given stock. Once the indicator is applied to a chart, lines form a channel around the present price. They are applied to stocks and futures markets.
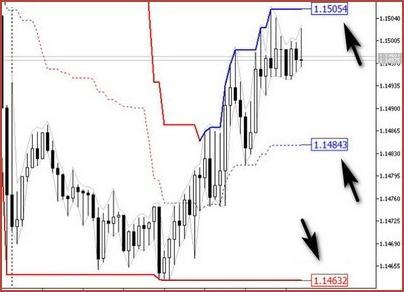
Donchian Channels highlight trends and ranging periods in day trading. Other than the two upper and lower lines, there is an additional option of having a third line between them. It is the average of the upper and lower channel lines. The indicators work on all time frames, such as five-minute or one-minute charts.
As a rule of thumb, the smaller the time compression, the more numerous the signals will be, assuming that trade signals are based on price closing over and under the channels. But, it is good to remember that more signals do not always equate trading profit.
History of Donchian Channels
Donchian Channels is named after its creator Richard Donchian – a writer, trader, and fund manager. He is also considered the ‘father of trend following’ and credited for pioneering the money management industry.
Richard started working on the stock market by accident, driven to recover the funds lost during the ‘Great Depression.’ After trying numerous rules and systems of control, Richard Donchian had to abandon the complex trading strategies of his day and began developing the single channel that is accredited with his name.
His market-based strategies all have the foundation of price action. Richard’s work is championed by multiple names in the financial world, with the Turtle trading group being the most well-known of them all.
Some basic guidelines or ‘crowd instincts’ that form the basis of the Donchian Channels are as follows:
- Oversold and overbought assets
- Psychology of placing stop-loss and take-profit orders
- Ride profits and limit losses
- Small positions are advisable when the market state is uncertain
- Be wary of acting upon public opinion
How Donchian Channels can be adjusted and how is it useful for traders
Calculating price channels are based upon the construction of horizontal lines between the maximum and minimum asset price reached over a certain period of time. Donchian Channels use a 20-day period. These parameters can be changed from the settings modal.

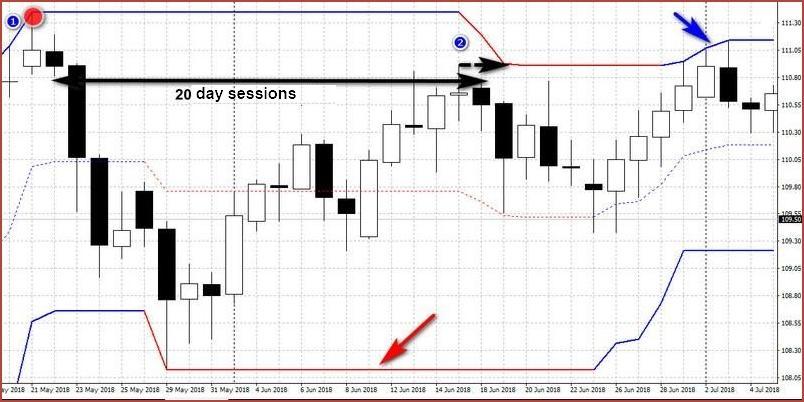
The figure given below shows the principles of defining and constructing horizontal lines.

At point 1, we have the daily maximum that determined the upper limit. This went on for 20 sessions consecutively. Only on the 21st day, it dropped out and the limit shifted to the next maximum for 20 days at point 2.
In the figure, observe the color change of the lower and upper borders. This is an advanced version of the indicator that automatically highlights the trend.
- Red shows that the currency pair is falling
- Blue shows that the currency pair is rising
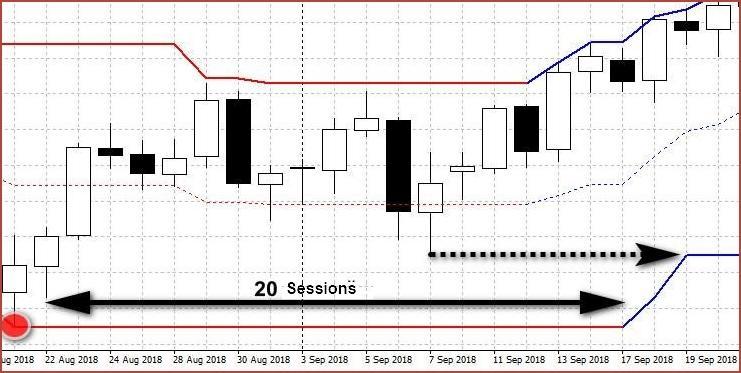
Similarly, we have the defining and constructing of the lower channel border. It is defined for a minimum of 20 days after which there is a shift and a new low is redrawn.

Other than the 20 sessions redrawing, both horizontal lines increase and decrease every time new extremes are appearing. These look like ‘steps’ created on the uptrend and downtrend.

Basic Strategies using Donchian Channels
Most traders incorporate Donchian Channels into their own trading by utilizing strategies that are devised by others. However, you can create your own. Traditionally, this trend strength indicator highlights the breakout positions, which are the point at which prices move through a prior low or high.
When identifying price movements between toughs and peaks in a stock’s price, these channels appear to be the most significant. They are often used to enter potentially emerging trends.
According to one strategy, traders can use the indicator to buy long as the price moves over the average line or sell short as the price goes below the average line. According to another strategy, traders might exit when the prices get to the mid-band.
Basic strategy variations
Trade shouldn’t be guided only by the basic principles and strategies mentioned above. Adding a moving average trade filter can aid in highlighting the trend.
The price may pull back to the lower band during a steady uptrend. Since the overall trend is up, this too is a potential area to buy. Similarly, the price may pull back to the upper band during a steady downtrend. In such situations, short trades can be taken close to the upper band as long as there is an overall downtrend. The middle band can be used for trade signals as well.
For entries, traders can use a longer period, such as the 20-day period. For exits, they can use a smaller period, such as a 15-day period. However, this may require traders to have two Donchian Channels being shown concurrently. It can be a little hard and cluttered to read off of two screens, which is why applying different colors to distinguish the channels helps.
Buy as the price goes beyond the upper band of the 20-day period channel and exit as the price goes below the lower band of the 15-day period channel. On these settings, a trader should sell short as the price dips while remaining in the longer-period channel. Conversely, when the price goes beyond the upper band, exiting is recommended in the shorter-period channel.
Find a strategy that suits you
As a trader, you should play around with the settings of the indicator and find the parameters that aid you with the market you are trading. The channels can assist you in separating the times when potential trends are ending or starting.
There is no indicator that works fully well all the time. There are times when the market moves unpredictably. On such occasions, the signal produced by any indicator won’t be profitable. Trading successfully boils down to testing multiple strategies before using them with actual capital. Once you have established a strategy, test it over multiple trades and days on a demo account. If the strategy produces reliable profits, only then you should start using actual capital.
The Bottom Line
Donchian Channels highlight the difference between the highs and lows of previous days (based on your period settings) and indicate the volume of a market.
Though some may use the channels simply to measure the value, others use them for actual trade signaling. For the latter purpose, the indicator becomes fundamentally trend-following.
Typically, long trades are made at a break over the upper band while short trades are made at a break below the lower band. Trade exits, on the other hand, are signaled through the mid-band that can be added to the channel.