What is behind the theory?
American accountant and author Ralph Nelson Elliott is the creator of the Elliott Wave Theory in the 1930s. At the time of its development, the general perception regarding stock markets was that they behave in a chaotic or random manner. However, Elliott correctly believed that stock markets traded in repetitive patterns.
Elliott proposed that an investor’s predominant psychology resulted in trends in financial prices. He found that swings in recurring fractal patterns were found in both mass psychology as well as financial markets. Just like the Dow theory, Ralph Nelson Elliott’s theory recognized that stock prices move in waves. However, he was able to break down and analyze them in much more detail since the theory recognized the fractal nature of markets. After discovering that stock index price patterns are structured in a similar manner, he began to examine how these patterns are used as predictive indicators of market moves in the future.
Elliot discovered several reliable characteristics in the wave patterns and based his detailed stock market predictions on them. The impulse wave travels in the larger trend’s direction, consisting of 5 waves in its pattern. A corrective wave, on the other hand, travels in the main trend’s opposite direction.
Motive and Corrective: Five Waves Pattern
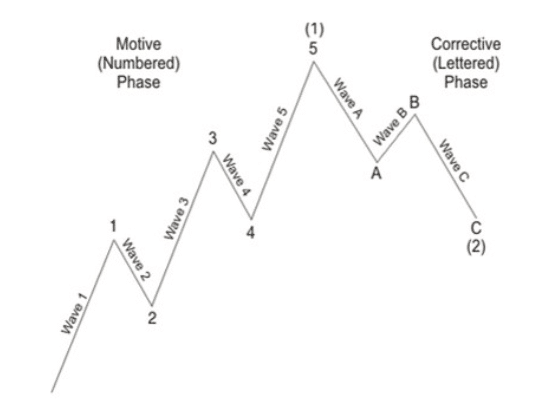
The basic pattern of market progress under the Elliott Wave theory is the motive wave. These are then further subdivided into five waves, labeled with numbers. Among them, the 1, 3, and 5 waves move in the direction of the impulse or underlying trend. The other two waves i.e. 2 and 4 act as retracements or countertrend interruptions of the motive wave. The market at any time is somewhere between the basic 5 wave pattern at the trend’s largest degree.

Rules of the 5 wave pattern:
- According to EWI, Wave no. 4 cannot intrude into Wave1’s territory. In the case it does, it indicates that the market’s move is a part of a larger motive wave. This could be progressing lower or higher.
- According to the Market Technicians Association, wave 1 cannot be retraced by wave 2 more than 100%. It will cease to be a corrective wave if it does, moving in the direction of a larger motive wave.
- The strongest part of the market is Wave 3. Compared with Wave 1 or 5, it cannot ever be the shortest by price.
A complete cycle of wave development is made up of eight waves. These consist of a wave subdivided into 5 waves as well as a 3 wave corrective one. The corrective wave consists of waves A and C which are moving in the motive wave’s opposite direction. It also consists of an intervening retracement wave called B.
The zigzag corrective phase, Wave B ends higher than where Wave A starts in case of a bear market and lower than Wave A in case of a bull market.
Elliott Wave and Fibonacci Numbers
Leonardo Fibonacci of Pisa, who was a famous 13th-century mathematician came up with the Fibonacci ratio of 0.618. It bases itself on a sequence of numbers where the next higher number is the sum of the previous two adjacent numbers. For example, 1,1,2,3,5,8,13.. and so on.
The Fibonacci ratio exists throughout nature, such as in the DNA double helix, the breeding habits of rabbits, the arrangement of flower petals, a galaxy spiral, the proportions of the human body, etc. For this reason, people call it the divine ratio or the golden ratio.
The five waves of a motive of phase in the Elliott Wave, have a Fibonacci relationship with a complete cycle’s eight waves. Each of these waves or phases tend to have the same relationship with the others. Thus, a retracement phase is usually up to 0.618 or close to (1-0.618) =0.382, the length of the motive phase.
Can You Adjust it To your Trading Now?
Traders can know a lot about prices if they follow impulsive and motive waves. This is because price also moves in the same way. A large price move is an impulse wave with associated trends. The movement of price up is more than the movement of price downwards when it occurs between the large up waves. This allows the uptrend to reach higher prices. The smaller waves occurring within a trend are the corrective waves.
The price makes the largest moves in the direction of the impulse waves. Trades should be in the same direction as impulse waves provide a better chance of making a larger profit than using corrective waves.
Traders can enter into a trend trade by using corrective waves to capture the next impulse wave. They can buy during corrective waves or pullbacks in uptrends, subsequently riding the next impulse which takes the price higher. Traders can profit from the next impulse wave down by short-selling during corrective waves in a downtrend.
Traders can use impulsive and corrective waves to determine the changing direction of a trend. A larger down move occurs when the price chart shows big moves to the upside with small corrective waves in between. This signals that the uptrend is over.
Since the impulses are in the trending direction, the big move to the downside indicates that the trend is down. When the trend is down, any big up wave occurring can indicate the trend being up. Traders should look to buy during the next corrective wave.