In forex, one of the beautiful advantages is how traders analyze pairs rather than standalone markets. So, for instance, if we are trading cable, there are two entities to observe at any given moment, the British pound and the US dollar.
When one part of the quote becomes weaker, the other should gain strength, and vice versa. Such correlations are in constant motion in forex on all time frames. Any trader wishing to enhance their understanding of the markets constantly analyzes these weak and strong points across multiple markets.
Studying correlations helps us forecast potential moves, ensure we don’t increase risk unnecessarily, and some can also use it for hedging purposes.
What is correlation?
Correlations are statistical measures of the relationship between two forex instruments.
When pairs generally move in the same direction, we refer to this as a positive correlation or positively correlated markets. Conversely, when pairs are usually traveling in the opposite directions, we refer to this as a negative/inverse correlation or negatively/inversely correlated markets.
When two markets do not typically move in the same or inverse direction, there is no correlation. It’s crucial to appreciate correlation only considering direction rather than magnitude. For example, two pairs may share a positive relationship.
However, one might move 50 pips while the other moves 100 because of their volatility. On a more technical basis, several charts exist actively tracking the correlations of many markets through coefficients.
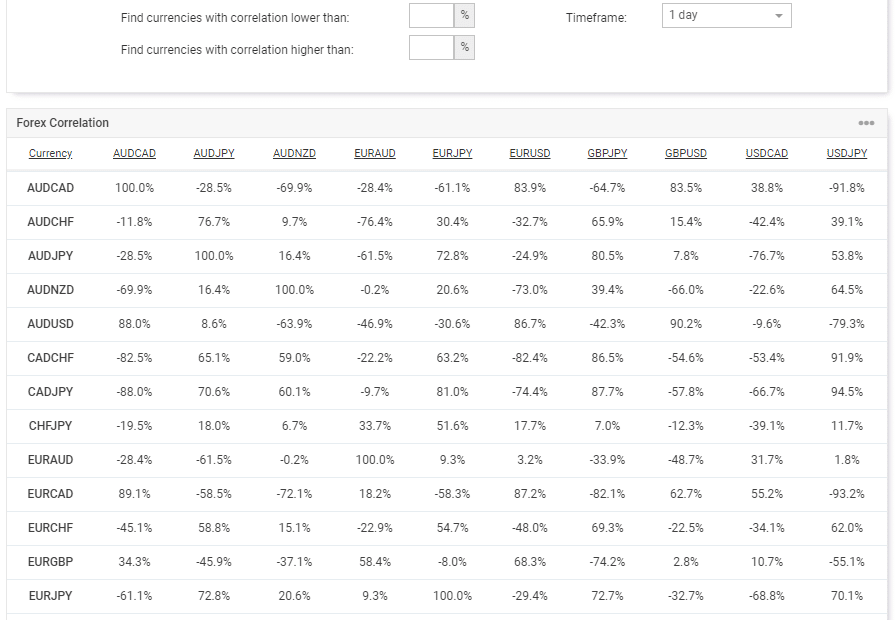
A coefficient measures the relationship using numbers ranging from -100% to 100% or -1 to 1. For instance, positively-correlated markets should have a coefficient closer to 100% or 1, and vice versa for negatively-correlated instruments.
Analysts consider markets with a correlation above or below 70 to have a strong positive or negative correlation and one to which traders should pay close attention to. A correlation chart will show these relationships across a plethora of forex markets and how they act on all the commonly-used time frames.

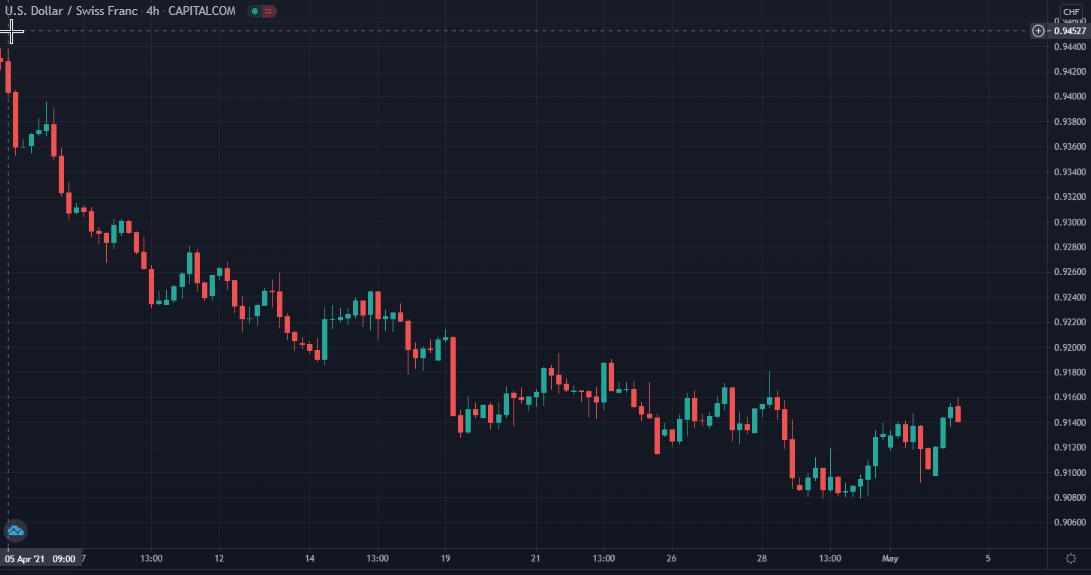
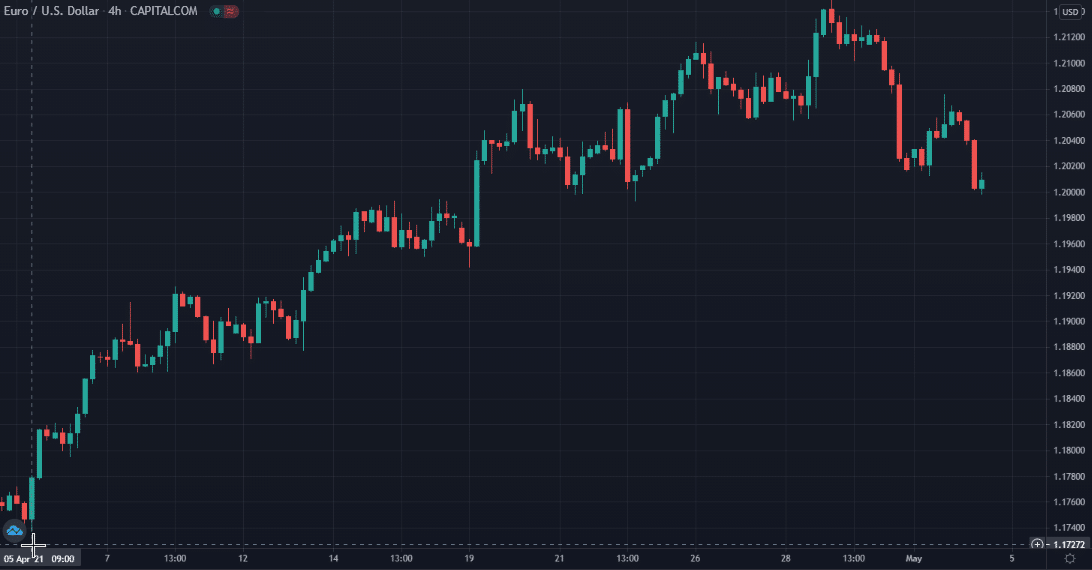
Fortunately, there are several markets historically sharing a consistently strong link without needing to know their coefficients. For example, the inverse correlation between USD/CHF and EUR/USD is well-known because of the relationship between Europe and America.


Other pairs exhibiting historically strong correlations also include:
- AUD/USD, EUR/USD, GBP/USD, and NZD/USD often move opposite to USD/CAD and USD/CHF because of the dollar being the base or quote currency.
- Yen-based cross/minor pairs (AUD/JPY, CAD/JPY, EUR/JPY, GBP/JPY, NZD/JPY, USD/JPY) share a positive correlation due to the Japanese yen being the quote currency.
It’s crucial to note the correlations above are only for the major and minor pairs. Many exotics with AUD, CAD, CHF, EUR, JPY, NZD, and USD as part of their quote will typically exhibit a noticeable connection when compared with their counterparts.
How can correlations help traders in forex?
Correlations can aid traders in several ways.
Risk management
Perhaps the most vital benefit is risk management. Even though we have access to tens of markets from our brokers, we should really only pick a handful at any time since the majority of them will be moving in two directions.
For instance, if one sees a buying opportunity on EUR/USD and a selling opportunity on USD/CNH, these instruments generally move opposite to each other because of the dollar. By taking these positions, the trader is unnecessarily increasing the risk.
If both markets moved against them simultaneously, they would likely have running losses on each position. Correlations emphasize why over-trading is generally a bad idea and that traders only need to focus on a handful of pairs.
Hedging
Traders use correlations for hedging purposes. If we refer back to our previous example of EUR/USD and USD/CNH, a trader could instead buy EUR/USD and buy USD/CNH as a hedge. If their original EUR/USD went against them, the gains on USD/CNH should offset their losses.
Forecasting potential moves
Lastly, knowing correlations can help traders forecast potential moves. A correlation doesn’t offer a minute-by-minute relationship of pairs, only the direction.
Let’s imagine we saw AUD/JPY break a low, and we were analyzing EUR/JPY. We could see the latter not moving at all while the former may continue making new lows. The probability is high EUR/JPY should eventually make a downward movement, even if it didn’t necessarily move simultaneously as AUD/JPY.
Mistakes to avoid with correlations in forex
Perhaps the biggest mistake to avoid with correlations is assuming they always remain constant. Sadly, they will sometimes change depending on several factors, one of which is the period reference.
For instance, EUR/USD and USD/CHF do have a reliable relationship. However, different time-frames may show opposite movements depending on EUR, USD, and CHF strength or weaknesses.
Understanding this attribute is especially crucial for hedging because there is never a guarantee to offset a loss through correlation completely. Therefore, traders should always split their risk in half when performing hedged trades rather than allocating the same portion of their account as they typically would with one order.
Generally, correlations remain more consistent in the long term. Shorter time-frames can exhibit unusually high volatility where markets easily move out of the correlation.
Final word
One of the most significant advantages of forex from a technical standpoint is the power of correlations. Since we express currencies in pairs, we can find discrepancies in the weakness or strength of one currency versus another.
Unlike more individual instruments like commodities, we can better understand what moves a pair overall by comparing its complement. Correlations also aid tremendously with not doubling up on risk.
As with anything in forex, it’s not foolproof. Thus, it should not be something traders rely upon solely.