The measured move down (MMD) is a downward movement of price in a chart pattern that is followed by a retracement and then continues to slope downwards. It describes a bearish reversal in the intermediate period. The retracement moment acts as a corrective phase. The longer the corrective phase, the higher the chance of the pattern meeting the price target. In a bear market, the decline of this downward movement is steep and long.
The measured move downs are also called swing measurements. The swings tell the trader how far down the price is likely to go. Swings initiate price channels in a three-part pattern:
- a reversal (decline)
- price consolidation retracement
- continued decline
Unlike other patterns, the MMD is a long-term pattern, and it forms within a few months. Also, the confirmation of this pattern occurs when the retracement has been identified.
Identification
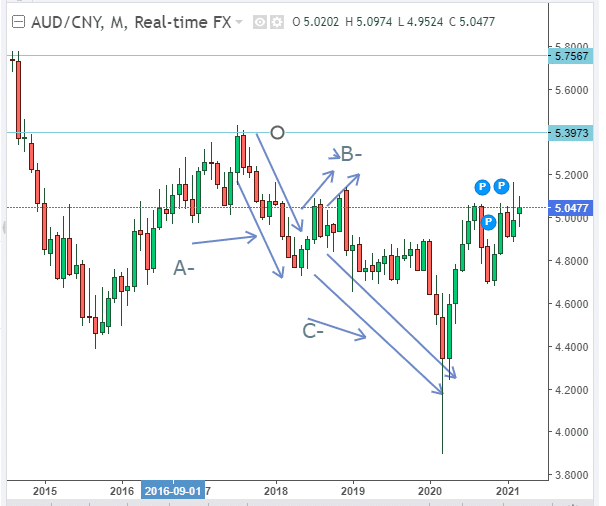
The measured move-down pattern consists of a 3-part formation. In figure 1, we have identified a forex chart of the Australian dollar vs. the Chinese yen (AUD/CNY). The chart has three distinct parts A, B, and C. Our analysis runs from mid-2017 to the first quarter of 2020.
Price uptrend before the pattern
Before the pattern forms, there is a bullish prior price trend. This feature makes it possible to have a bearish reversal. If the prior price trend is a downslope, the pattern will form a continuation as opposed to a reversal (see figure 1). The prior price rose to a height of 5.3973 before the first slope, A began. The decline continues with some intermittent price changes, but the difference is minimal and almost negligible.
Reversal Begins (A)
Part A shows the reversal or decline in price from the prior uptrend. The decline, as it will be noticed, takes months, if not weeks. The trader at this point will want to be trading on a long-term basis after establishing the formation of the measured down movement. The decline occurs from 5.3973 to lows of 4.7000. There are intermediate price changes, but the decline forms a dominant channel that goes all the way until the retracement level is reached.
Retracement level (B)
Part B is rightly called a retracement and not a bullish reversal, as some may think. Retracements are temporary price changes, while reversals occur in the long-term.

Figure 1: AUD/CNY Analysis
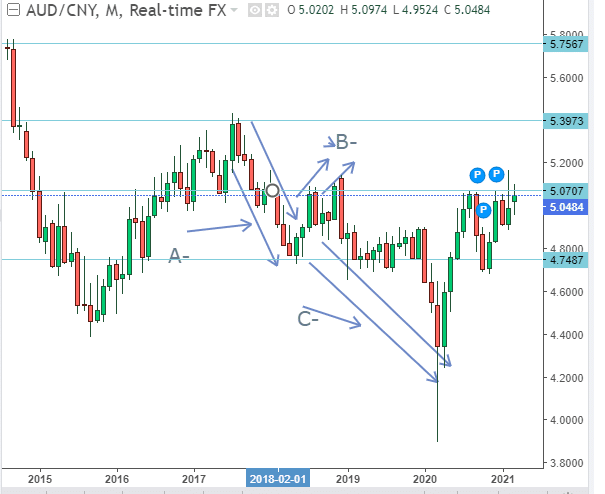
The retracement, as seen in figure 2, occurs from 4.7487 to a high of 5.0707. It acts as a consolidation phase. Prices in our case have risen by 6.78% as the price pattern forms an upward slope. It is also called the corrective phase, where prices are known to rise as much as 62% before they resume the prior downtrend. Also, the prices may rise horizontally as the channel looks to set up a trading range for the trader.

Figure 2: Retracement Identification of the AUD/CNY pair
Declining continuation phase (C)
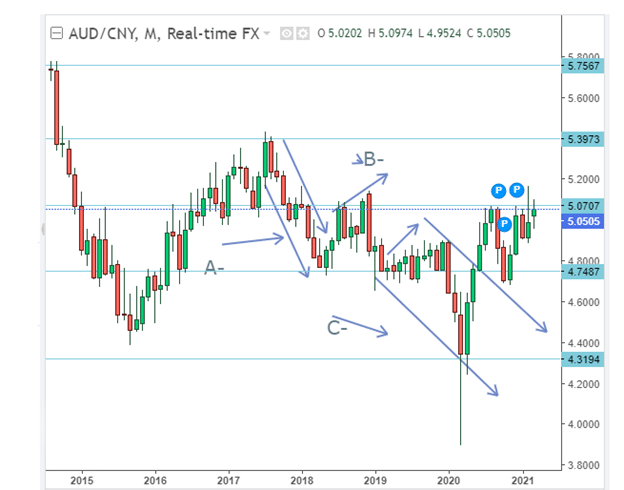
After the retracement, prices continue the prior downtrend. Here the price moves further down, almost at the low annual position. The two declines form leg patterns that fit within the general MMD. We must also note that there are two retracement levels in our chart. The second corrective phase confirms the first phase. We can join the two phases so that they form one. So, our final measured move-down formation is shown in figure 3.

Figure 3: Final MMD pattern
In the second leg, after the retracement, the currency’s pair lowered from 5.0505 to 4.3194 (a decline of 14.48%). Prices have declined almost in a straight-line fitting in the price channel.
Aspects to consider when following the MMD pattern in trading
- Ensure the price trend of the first leg of the MMD is in a straight-line and not curved or rounded. Prices may tend to move lower but end up the curving, similar to a scallop. Rounded first legs do not complete the pattern.
- Watch the corrective phase so that prices do not rebound or rise higher to those of the first leg. Avoid the pattern if prices rise near this level.
- Take note of any other legs other than the first or the second. Your trade should majorly cover these two areas.
- After prices hit the low in the second leg, they bounce back several times before the upward is sustained (See figure 3).
Trading strategy
- Use the price movement of the second leg to get the movement of the first leg and determine the price target. Get the difference between A-B (5.3973-4.7487) and B-C (4.7487-4.3195). Add the two positions to the current price, say 5.0709, to get the price target (upwards). Subtract the total difference to get the down movement in case you plan to short the stock.
- As soon as you spot the progress of the measured move down pattern, short the stock or the currency pair. Keep track of the movement of the first leg as it declines until the corrective or the retracement phase has been reached.
Take note that the retracement phase either shows future support or resistance. In our AUD/CNY analysis, the corrective phase has provided support. In other instances, it gives resistance, and prices continue to move lower.
- In case you plan to short the stock, but the stop loss at least 0.15 (15 pips) above the corrective phase. In the case of figure 3, if the corrective phase is at 4.9000, then the stop loss should be placed at 5.0505 when shorting the stock.
Take note as you short the stock that you should not go beyond the region the prior price movement began before the first leg was formed. Set a limit in case prices continue to decline past the prior price beginning point.
Conclusion
The measured move-down pattern is a 3-part movement showing a bearish reversal from a bullish trend. It is used to predict the price target using the corrective or the retracement phase as the intermediate point. The three parts from 2 leg patterns have near-equal heights.