A partial rise in forex is an increase in the trading pair’s price that does not touch the top or uppermost trendline. It is not high enough and soon collapses and rejoins the prior decline.
A partial decline in forex is the drop in the price of a trading pair that does not touch the bottom or lowermost trendline. The decline is soon overtaken by surging prices and rejoins the prior upward movement.
Defining support and resistance
In a partial decline, prices move downwards before reversing in an upward breakout. In contrast, a partial rise (occuring in a downward price movement) shows that a downward breakout is on its way. Therefore, both the partial decline and rise are used to predict the direction of the breakout.

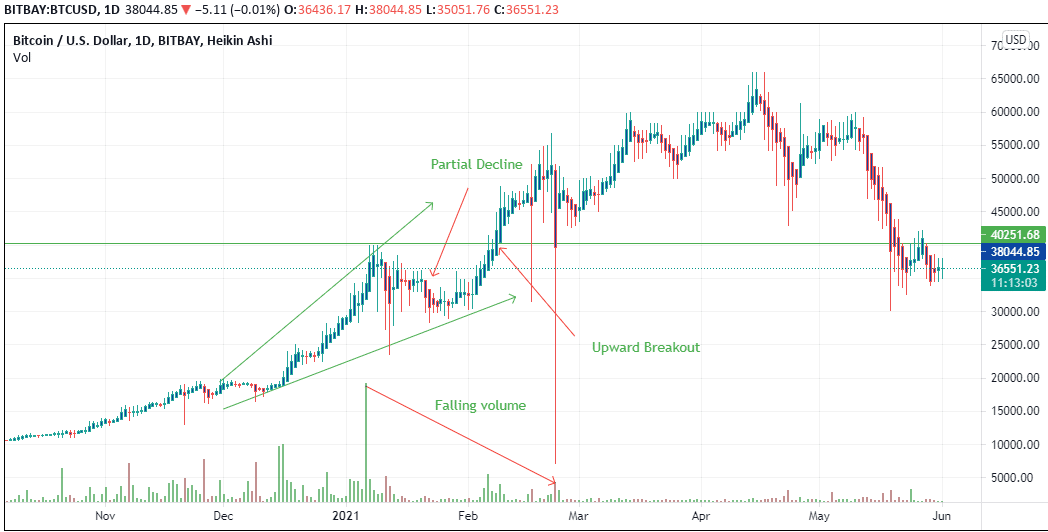
In the image above, prices are seen to rise and they touch the top trendline. When prices begin to decline, they barely touch the bottom trendline and form a minor low. An upward breakout is obvious since mid-December 2020 after prices hit the minor low, which is followed by a raise in volume. This trend continues into 2021 to be replaced by the partial decline soon after the peak in volume. The trader should wait for the partial decline to form before they can confirm the breakout, with $40,251 being the key psychological price level and serving as the support level from February 8th onwards.
The upward breakout is also preceded by the growing volume during the strong uptrend that lasted from February 15, 2021, to February 26, 2021. The declining volume shows that there is reducing momentum towards the sell-side as buyers gain control.
Watching throwbacks and pullbacks
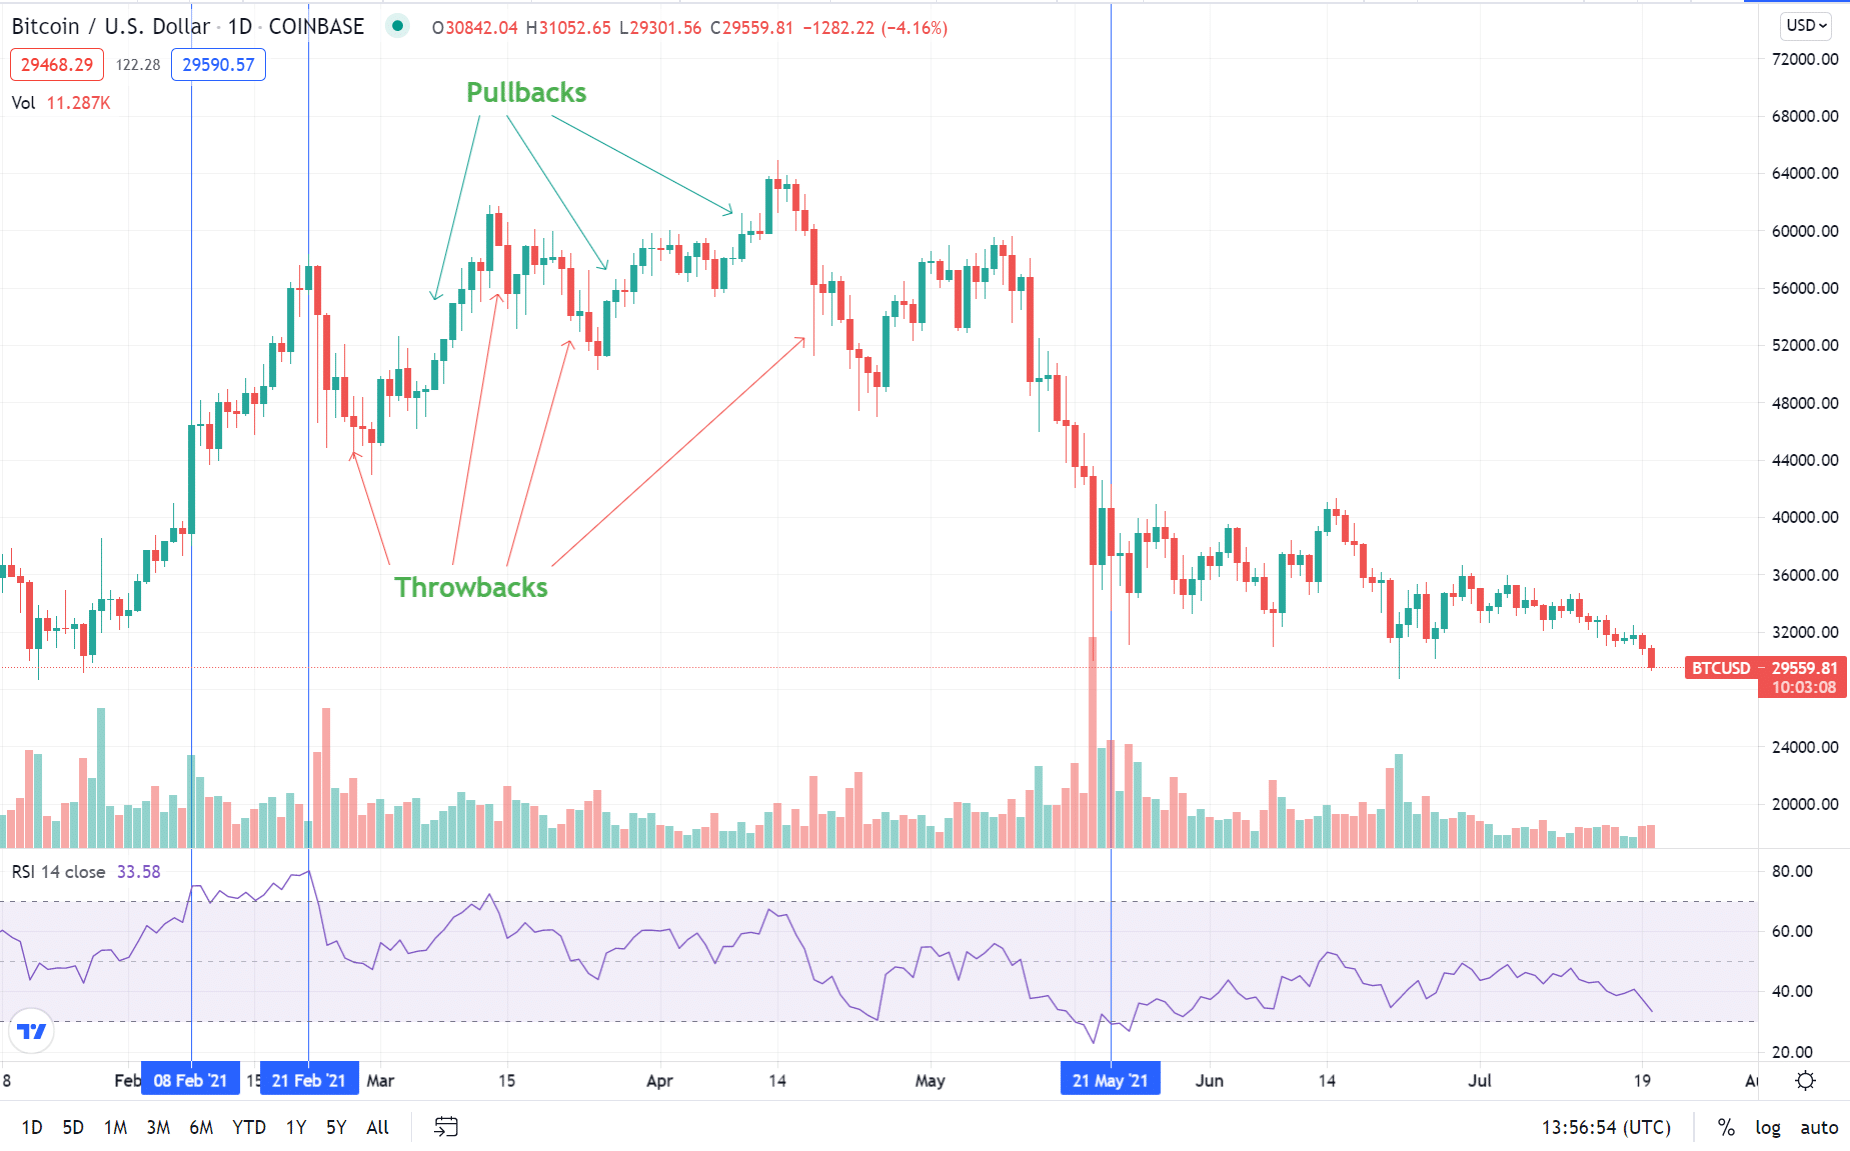
Following the occurrence of the partial decline, there is a throwback and a pullback that also determine the movement of the pair’s price.

In the example above, the upward breakout took place on February 8, 2021, after the partial decline. The price at this point rose to a high of $40,251.68. At this point RSI hit 80.18 confirming that the pair was overbought and the price correction inevitable. Hence, there was a throwback that lasted between February 22 and February 28, 2021, returning the price to this level until another upward reversal, which we can regard as a pullback, occurred on March 1, 2021.
After price broke the support level on May 20, we expect a continued decline as the pair looks for a key support level. The price was falling until it reached $36,551.23. Note that a throwback indicates an imminent change in direction to the upside. The trader should wait for the downtrend to confirm as a partial decline before placing the order in an attempt to buy the dip.
Partial rise vs. decline
The partial rise occurs when the trading pair’s price touches the lower trendline but only nears or gets close to the upper trendline. After nearing the top trendline, it forms a minor high with the entire pattern assuming an inverted V-shape. Following the minor high, the pattern forms a downward breakout.

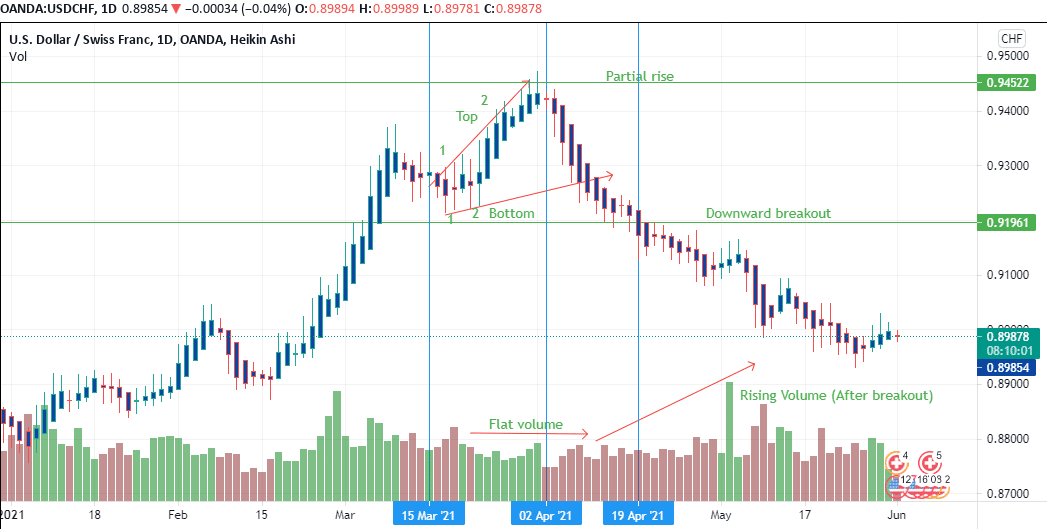
In the image above, we can see the downtrend starting April 2, 2021, was preceded by a partial rise that is seen beginning on March 21, 2021. The rise is followed by a downward movement after it hits a new high at 0.9452.
The USD/CHF price keeps falling after it reaches the high of 0.9452. It confirms the downward trend breaking the 0.91961 support level on April 19, 2021. This level was first touched by the pair price on March 2 and broken on March 4 when it served as resistance level. The downtrend continued through April until a minor throwback that lasted in the first three days of March.
While four waves in the upward trend beginning from the year start, each of them broken by a minor throwback, there are certain signs indicating that the notion we can observe between March 15 and April 19 is nothing but a partial rise before the imminent downward trend.
First, the price on April 19 reached the 0.9196 level, which is -2.71%. A decline of more than 2.5% from the minor high to the breakout area shows the prior upward movement is a partial rise.
Second, the volume is low. We see that the volume chart is flattened as the partial rise continues to form. The traders holding long positions in the asset will be preparing to sell the pair at this point. The constant number of buyers during the upward movement showed indecision as well as the absence of large transactions. After the decline begins, and towards the next breakout region at the beginning of May, the trading volume increases as more traders continue to short the USD/CHF forex pair.
A partial rise fails when it is followed by an upward breakout as opposed to a downward breakout. In the case of the USD/CHF pair, the pattern qualifies as a partial rise, since it is confirmed by a downward breakout.
Finally, the beginning of the partial rise also occurs before the breakout. The trader can observe the number of touchpoints on the upper and lower trend lines forming the pattern. The arrow in the chart show the direction of movement. A true partial rise should have a minimum of two touch points on each trendline. The appearance of these touchpoints serves to confirm that the pattern is a valid partial rise pattern.
Conclusion
Partial decline or rise patterns are vital in determining the breakout direction. A partial decline is followed by an increase in prices due to the upward breakout. The partial rise is followed by a decrease in price due to the formation of the downward breakout.
Go long or buy when you spot a partial decline. Sell or trade short when you spot a partial rise. Ensure to confirm the validity of the partial rise or decline patterns using volume trends and the number of touches on the trendlines.