The Bollinger Bands indicator is a series of 3 trend lines, a set of two trend lines plotted at negative and positive standard deviation away from the third centered moving average. This technical indicator is useful for traders to identify the trend of the underlying instrument as well as its volatility over the specified period.
The price trend of the underlying instrument is assessed by the central line, which corresponds to the simple moving average. In contrast, the bandwidth of the two deviation lines represents the volatility range. The Bollinger Bands can be useful to set take profit and stop loss levels according to the market volatility. The upper band of the indicator defines the positive standard deviation while the lower band is the negative standard deviation (Fig.170).
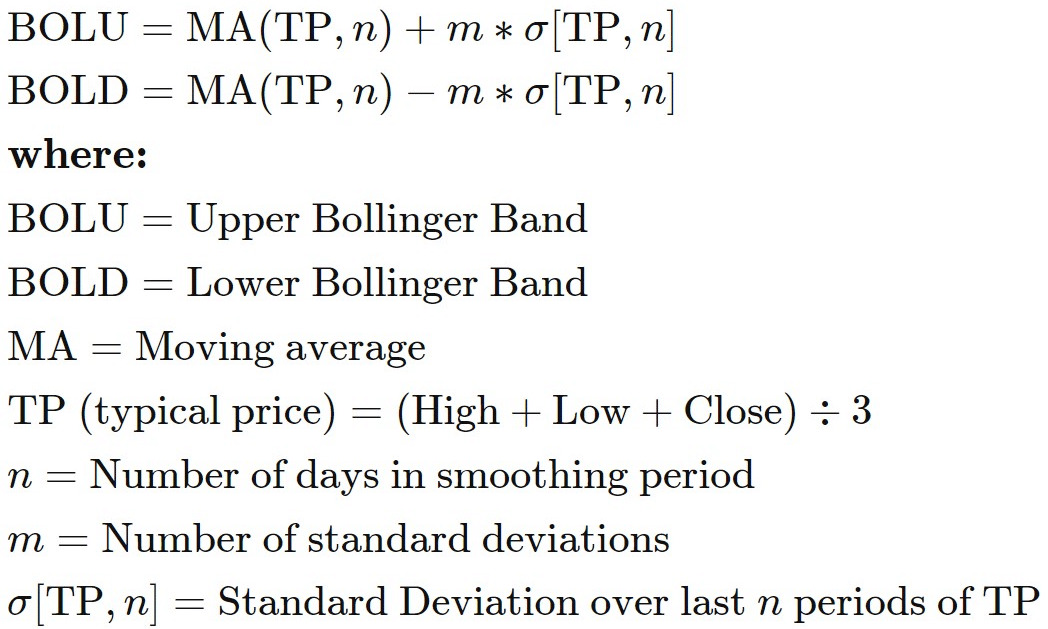
Fig.170 Bollinger Bands formula
In this guide, we will go through how to use the Bollinger Bands to set buy and sell signals and explain the notion used in MQL4 and MQL5 to retrieve data points. MQL4 Bollinger Bands function retrieves the indicator data points, unlike MQL5, which requires the data to be stored in the indicator buffer and a declared “double type” array. It may seem confusing, but we will explain this MQL5 specificity step-by-step. To conclude, we will demonstrate an example of practical usage.
How the indicator signal works for the Bollinger Bands
Before we dive into the Bollinger Bands code implementation, let us explain the most common buy and sell signals interpretation of this indicator. As this indicator is a trend-based statistic one derived from the price moving average, the signal will be very similar to a simple moving average to determine entry and exit. There are a few strategies on how to use the Bollinger Bands to detect a buy or sell entry. In this guide, we will highlight the two most frequently used chart patterns for the ranging and for trending market.
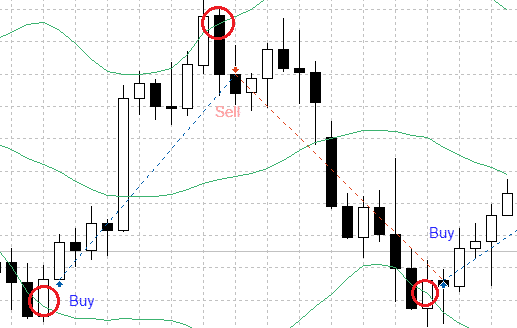
Buy/sell signal range pattern
| Buy signal: If the two previous closing prices are lower than the lower band and the current bar closed above the lower band, a buy signal is initiated.
Sell signal: Conversely, the sell signal is released when the two previous bars close consistently higher, with the current bar ending negative below the previous bar. |
|
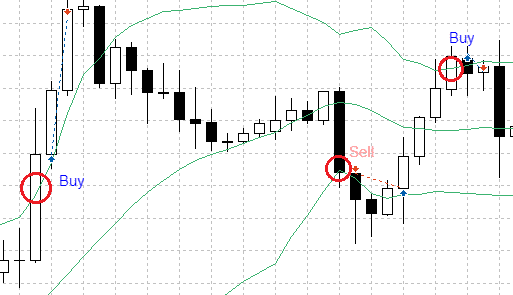
Buy/sell signal trend pattern
| Buy signal: If the current bar closes above the upper bar, while the two previous bars remain below it, a buy signal can be triggered.
Sell signal: If the current bar crosses the lower band while the two previous bars stayed above it inside the bands, a sell signal can be set. |
|
How the Bollinger Bands indicator stores its data points
The Bollinger Bands indicator keeps its data points in a dedicated indicator buffer which is a dynamic array. The size of the array is automatically handled by MetaTrader at its initialization. An indicator buffer is a timeseries array, hence, it has the unique feature of reverse indexing. It means that the array is sorted in a descending manner where the last value is on the left side of the array. This dynamic array is used to store historical data and include the time information.
Consequently, the time-series element with index zero contains the latest quote of a symbol. For instance, an indicator on the daily timeframe will have the current price at index zero and yesterday’s data at the position index one (Fig.171).
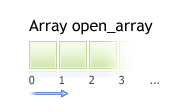
Fig.171 Indicator data points array
MQL5
To access the Bollinger Bands data, MQL5 requires the use of the CopyBuffer() function. This method does not apply to MQL4 as the MQL4 indicator function returns the value of the Bollinger Bands data point directly instead of returning the indicator handle, i.e., its unique identifier. The following parameters should be provided to collect the iBands() data points in MQL5.
- Provide the handle that is returned by the iBands() function.
- Provide the buffer number. You may provide zero to collect the upper band value, one for the lower band value and two for the base or middle band value.
- Provide the start position. You may provide zero to retrieve from the most recent data point. This number represents the index where zero is the most recent data point, and one is the previous data point.
- Specify the number of data points to retrieve from the iBands() function.
- Provide the variable where the data will be stored. The variable is a double type.
How to retrieve Bollinger Bands data with CopyBuffer() function?
- Declare a variable for the handle: int IndicatorHandle = iBands();
- Declare a variable to store indicator data: double bb_indicator;
- Copy the data to the indicator variable and retrieve data points
- CopyBuffer(IndicatorHandle, 0, 0, 100, bbu_indicator); //upper band
- CopyBuffer(IndicatorHandle, 0, 1, 100, bbl_indicator); //lower band
- CopyBuffer(IndicatorHandle, 0, 2, 100, bbm_indicator); //middle band
- Retrieve Bollinger Bands data point with bbu_indicator[0], bbl_indicator[1], bbl_indicator[2];

Fig.172 CopyBuffer() Function
How to access the Bollinger Bands indicator data
MQL4
The iBands() function will return the data point value according to the following parameters:
- The symbol of the traded instrument. You may provide a string such as “EURUSD” or use the function Symbol() to retrieve the symbol from the chart where the Expert Advisor is attached to.
- Provide the time frame using the enumeration value from the constant ENUM_TIMEFRAMES, for instance (Note that 20-period is the default ):
- PERIOD_CURRENT, for the current timeframe from the chart,
- PERIOD_M1, for the one-minute timeframe,
- PERIOD_D1, for the daily timeframe.
- Provide the standard deviation where two is the default value.
- Specify the Band shift where zero is the default value. Band shift is the number of a period shift from the instrument price. If you provide a shift of one, the band will be shifted to one unit back to the previous period.
- Specify the applied price using the enumeration value from the constant ENUM_APPLIED_PRICE, for instance:
- PRICE_CLOSE, for value, computed based on close price,
- PRICE_OPEN, for value, computed based on open price,
- PRICE_HIGH, for value, computed based on highs,
- PRICE_LOW, for value, computed based on lows.
- Specify the indicator data point to retrieve using the indicator enumeration value:
- MODE_MAIN to retrieve the middle band data points,
- MODE_UPPER to collect the upper band data points,
- MODE_LOWER to get the lower band data points.
- Provide the index of the indicator buffer where zero is the latest data point and one the previous data point.
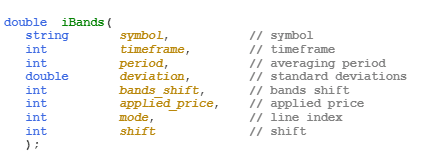
Fig.173 MQL4 Bollinger Bands function
MQL5
When calling the iBands() function, MQL5 will create the Bollinger Bands indicator in the MetaTrader global cache and returns its handle according to the following parameters:
- The symbol of the traded instrument. You may provide a string such as “EURUSD” or you can use the function Symbol() to get the symbol from the chart where the Expert Advisor is attached to.
- The time frame of the data point to extract using the enumeration value from the constant ENUM_TIMEFRAMES:
- PERIOD_CURRENT, to get data points from the current timeframe from the chart to which the Expert Advisor is attached to,
- PERIOD_M1, for the one-minute timeframe,
- PERIOD_D1, for the daily timeframe.
- The bands period for the average line calculation. The default value is 20-period.
- The horizontal shift of the bands.
- The standard deviation which by default is two.
- The base value to compute the indicator. By default, it is the close price, however, the applied price can be personalized with the enumeration constant ENUM_APPLIED_PRICE
- PRICE_CLOSE, for value, computed based on close price,
- PRICE_OPEN, for value, computed based on open price,
- PRICE_HIGH, for value, computed based on highs,
- PRICE_LOW, for value, computed based on lows.
Note that to retrieve data points from the iBands() function, you need to use it in combination with the function CopyBuffer().
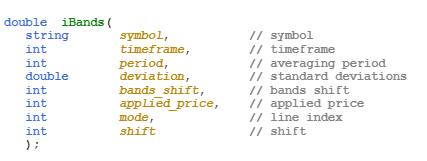
Fig.174 MQL5 Bollinger Bands function
Practical case
MQL5
Fig.175 demonstrates the use of the Bollinger Bands to generate a simple signal to trade a sideways market pattern by identifying the previous two bars closing price and to compare the values with the upper and lower bands to determine the trend direction.
Line 320: Declare the indicator handle and assign the content returned from the function iBands().
Line 321 – 322: Declare the indicator array that will store data points for each band.
Line 324 – 325: Get the latest 100 bars and store them in the bbu_indicator, bbl_indicator array.
Line 327 – 339: Conditional statement to compare the previous two bars close price with the upper and lower bands to define buy and sell signals.
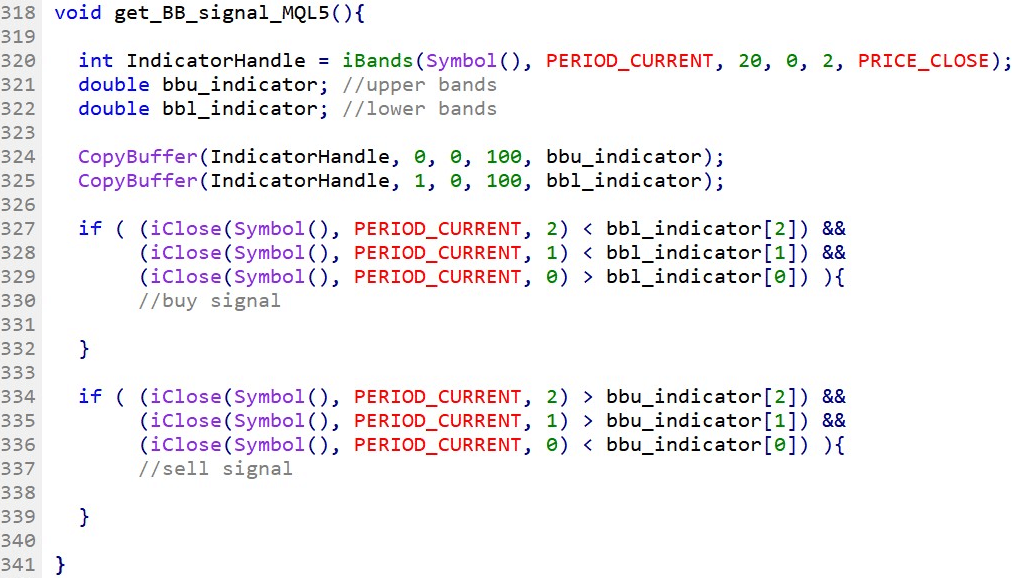
Fig.175 Bollinger Bands range trading signal example with MQL4
MQL4
Fig.176 exhibits the use of the upper and lower bands of the Bollinger Bands with the comparison of the two previous closing bars to determine the market trend and define a simple signal.
Line 347 – 353: Declare the Bollinger Bands variables with the function iBands().
Line 355 – 366: Conditional statement to compare the previous two bars with the upper and lower bands data points to determine and set buy and sell signals.
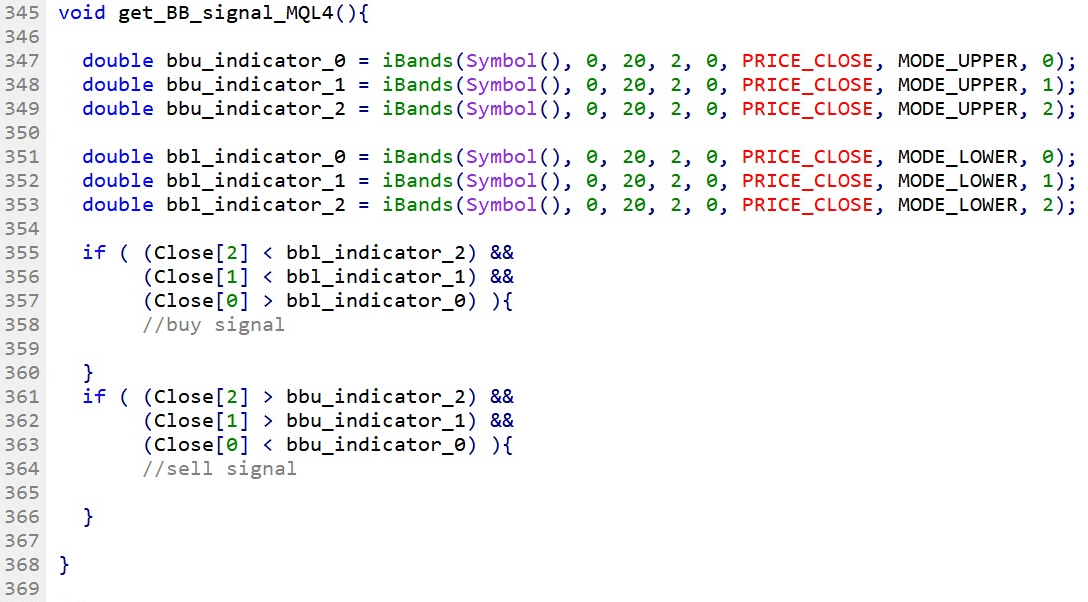
Fig.176 Bollinger Bands range trading signal example with MQL5