The Moving Average Convergence Divergence is a popular indicator known as the MACD. It comprises a histogram and one or two overlapping oscillator lines. The MACD provides essential information about the ongoing trend and momentum of the underlying traded instrument by identifying the connection between two moving averages by computing the difference between two exponential moving averages.
There are various approaches to interpreting the indicator. The most common one is to determine buy and sell signals by the oscillator lines crossover. Another approach is the histogram interpretation with the trend continuation or price and indicator divergence to spot possible trend reversal.
The MACD formula is quite simple yet powerful. It represents the difference between two exponential moving averages (EMA), a long-term and a short-term EMA. MACD is computed in two parts. The first calculation involves the computation of the exponential moving averages. The second part is the actual difference between the short-term and long-term EMA, as illustrated in Fig.252.
Part 1.

Part 2.

Fig.252 MACD formula
There are various ways to interpret the MACD indicator. In this guide, we will go through the most used methods to recognize potential entry and exit signals:
- the histogram and signal line crossover
- and the zero level crossover
We will also develop and guide you through the method to store the data points and detail how to retrieve them to build a trading strategy with MACD. MQL4 MACD function retrieves the indicator’s data point directly. On the other hand, MQL5 requires the data to be initialized and to be stored in the global cache before being attributed to a declared “double type” array.
Sounds a bit complicated? Let us dive into the details of this process and go through some practical illustrations with code ready to be used.
How does the MACD indicator work?
Before we dive into the details of the MACD indicator code implementation, let us go through the most prevalent trend-continuation, lines, and level crossover signals interpretation. There are many ways to read the MACD indicator. We will highlight the two most popular MACD patterns that involve the histogram and the signal line crossover.
Buy Signal
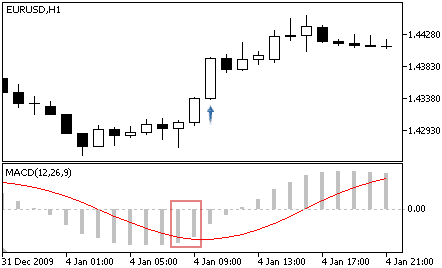
Histogram bar/mainline crossover signal occurs when the histogram is below the mainline and crosses above it. When the top of a histogram bar is above the mainline, a buy signal is initiated.
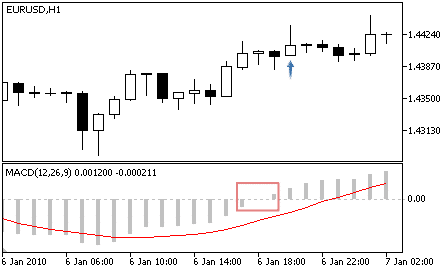
Histogram bar crosses above the zero level
When the histogram bar crosses above the “zero” level, a bullish momentum may continue. Therefore, a buy signal is expected at the following bar, which should be above the “zero” level.
Sell Signal
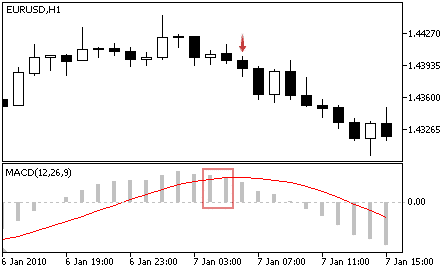
Histogram bar/mainline crossover signal
When the top of the histogram bar crosses below the main indicator line, it usually indicates the beginning of a downtrend. Therefore, a sell signal is expected at the following bar, which should be below the mainline.
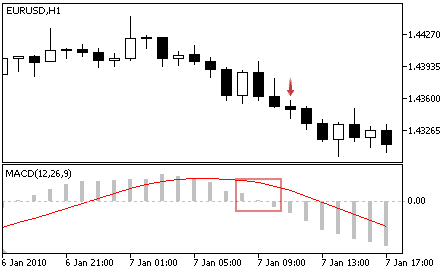
Histogram bar crosses below the zero level
When the histogram bar crosses below the “zero” level, bearish momentum may continue. Hence, a sell signal is expected at the following bar, which should be below the “zero” level.
How does the MACD indicator store its data points?
The MQL5 MACD indicator keeps its data point in a global cache which is a dynamic array and the indicator buffer. The size of the array is handled by MetaTrader and initialized when the expert advisor loads. An indicator buffer is a time-series array of reverse indexing. It means that the array is sorted in a descending order where the latest data point is on the left side of the array.
The time-series is used to store historical data and comprise the time information. Therefore, the time-series element with index zero contains the latest quote of a symbol. For instance, an indicator on the daily timeframe will have the current oscillator bar at index zero and yesterday’s data at the position index one (Fig.253).
MQL5 MACD function returns two data sets, the MACD histogram and the signal line. The histogram bars are stored in buffer zero and the signal line in buffer number one.
Buffer zero: MACD histogram

Buffer one: MACD oscillator signal line

Fig.253 Indicator data points array
MQL5
To access the MACD indicator data, MQL5 requires the use of the CopyBuffer() function. This approach does not apply to MQL4 as the MQL4 indicator function directly provides the value of the MACD data point instead of the indicator handle. The indicator handle is a sort of address to locate the data in the MetaTrader global cache. To initialize the MACD indicator data, the following parameters should be provided to the CopyBuffer() function:
- Specify the handle that is returned by the iMACD() function
- Provide the buffer number. You may provide zero to retrieve MACD histogram bars and one to get the signal line data points.
- Provide the start position. You may provide zero to retrieve from the most recent data point. This number represents the index where zero is the most recent data point, and one is the previous data point.
- Specify the number of data points to get from the iMACD() function.
- Provide the variable where the data will be stored. The variable must be a double type.
How to retrieve MACD indicator’s data with the CopyBuffer() function?
- Declare a variable for the handle: int IndicatorHandle = iMACD().
- Declare a variable to store indicator data: double MACD_indicator.
- Copy the data to the indicator variable and retrieve data points:
- CopyBuffer(IndicatorHandle, 0, 0, 100, macd_histogram_indicator);
- CopyBuffer(IndicatorHandle, 1, 0, 100, macd_signal_indicator);
- Retrieve the MACD data point with macd_histogram_indicator[0], macd_histogram_indicator[1], macd_signal_indicator[0], macd_signal_indicator[1].

Fig.254 CopyBuffer() Function
How to access the indicator data?
MQL4
The iMACD() function will return the indicator data point values according to the following parameters:
- The symbol of the traded instrument. You may provide a string such as “EURUSD” or use the function Symbol() to retrieve the symbol from the chart where the expert advisor is attached to.
- Provide the time frame using the enumeration value from the constant ENUM_TIMEFRAMES, for instance:
- PERIOD_CURRENT, for the current timeframe from the chart
- PERIOD_M1, for the one-minute timeframe,
- PERIOD_D1, for the daily timeframe.
- Specify the short-term averaging period to compute. The default value is 12-period.
- Specify the long-term averaging period to calculate. The default value is 26-period.
- Specify the signal averaging line period to calculate. The default value is 9-period.
- Specify the applied price for the calculation with the enumeration value from the constant ENUM_APPLIED_PRICE, for instance:
- PRICE_CLOSE, for the close price,
- PRICE_OPEN, for the open price,
- PRICE_HIGH, to use the highest price data,
- PRICE_LOW, to use the lowest price data.
- Provide which data points to retrieve based on the “indicator line” constant
- MODE_MAIN, for the base indicator, which is the MACD histogram,
- MODE_SIGNAL, for the signal line, which is the MACD oscillator.
- Provide the index of the indicator buffer where zero is the latest data point and one the previous data point.
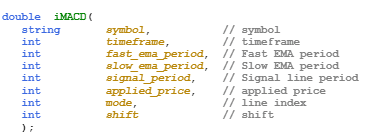
Fig.255 MQL4 MACD function
MQL5
When calling iMACD(), the function will create the MACD indicator in the MetaTrader global cache and returns its handle according to the following parameters:
- The symbol of the traded instrument. You may provide a string such as “EURUSD,” or you can use the function Symbol() to get the symbol from the chart where the Expert Advisor is attached to.
- The time frame of the data point to extract using the enumeration value from the constant ENUM_TIMEFRAMES:
- PERIOD_CURRENT, to get data points from the current timeframe from the chart to which the Expert Advisor is attached.
- PERIOD_M1, for the one-minute timeframe.
- PERIOD_D1, for the daily timeframe.
- Specify the short-term averaging period to compute. The default value is 12-period.
- Specify the long-term averaging period to calculate. The default value is 26-period.
- Specify the signal averaging line period to calculate. The default value is 9-period.
- Specify the applied price for the calculation with the enumeration value from the constant ENUM_APPLIED_PRICE, for instance:
- PRICE_CLOSE, for close price.
- PRICE_OPEN, for open price.
- PRICE_HIGH, to use the highest price data.
- PRICE_LOW, to use the lowest price data.
Note that to retrieve data points from the iMACD() function, you need to use it in combination with the function CopyBuffer().

Fig.256 MQL5 MACD function
Practical case
MQL5
Fig.257 demonstrates the use of the MACD indicator in MQL5 to create a buy and sell signal with the histogram and signal line crossover approach.
Line 244: Declare the indicator handle and assign iMACD() function handle with the specified parameters. For this example, we will provide the default settings of the 12-period, 26-period, and 9-period for the fast, slow, and signal line, respectively.
Line 245 – 246: Declare the two variables for the “double type” array to store the iMACD() indicator data points. The first one is for the MACD histogram and the second one is for the MACD signal line.
Line 249 – 250: Copy the latest hundred data points into the indicator array macd_histogram_indicator and macd_signal_indicator.
Line 252 – 268: IF statement to identify the MACD indicator pattern. If the MACD histogram bar crosses below the signal line, a buy signal is recognized. On the other hand, if the MACD histogram bar crosses above the signal line, a selling opportunity may be identified.
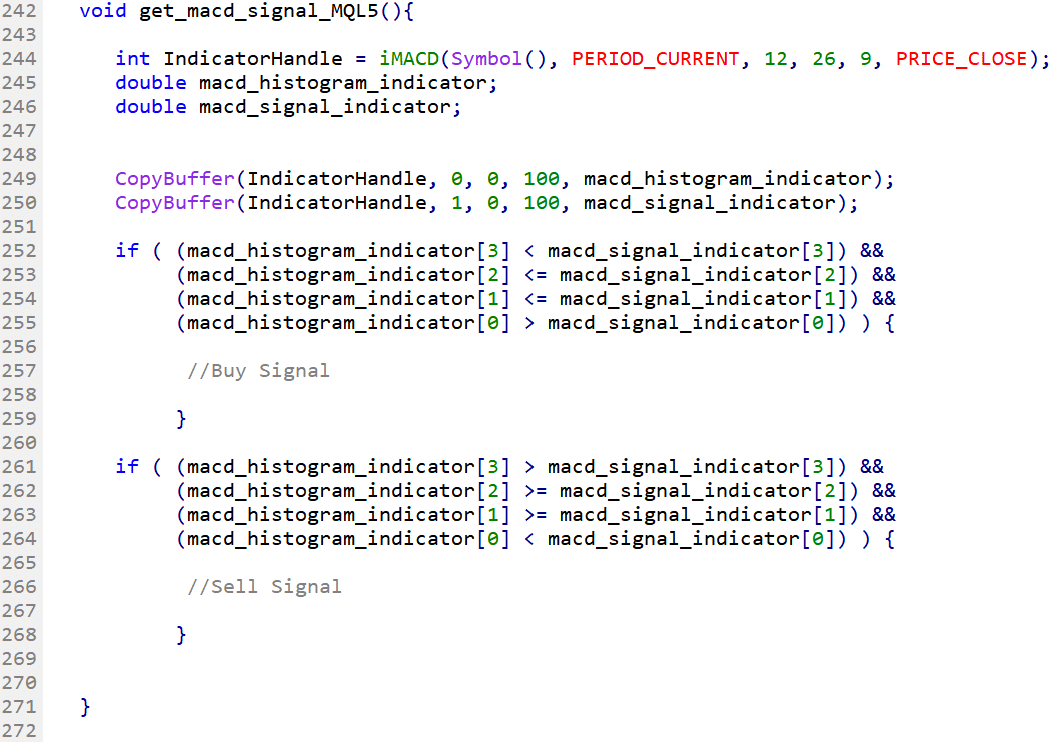
Fig.257 MACD signal in MQL5
MQL4
Fig.258 demonstrates the use of the MACD indicator in MQL4 to create a buy and sell signal with the histogram and signal line crossover approach.
Line 275 – 278: Declare and assign MACD histogram bars.
Line 280 – 283: Declare and assign MACD signal line data points.
Note that the last parameter of the iMACD() function is the index of the data point to retrieve.
Line 285 – 301: IF statement to identify the MACD indicator pattern. If the MACD histogram bar crosses below the signal line, a buy signal is recognized. On the other hand, if the MACD histogram bar crosses above the signal line, a selling opportunity may be identified.
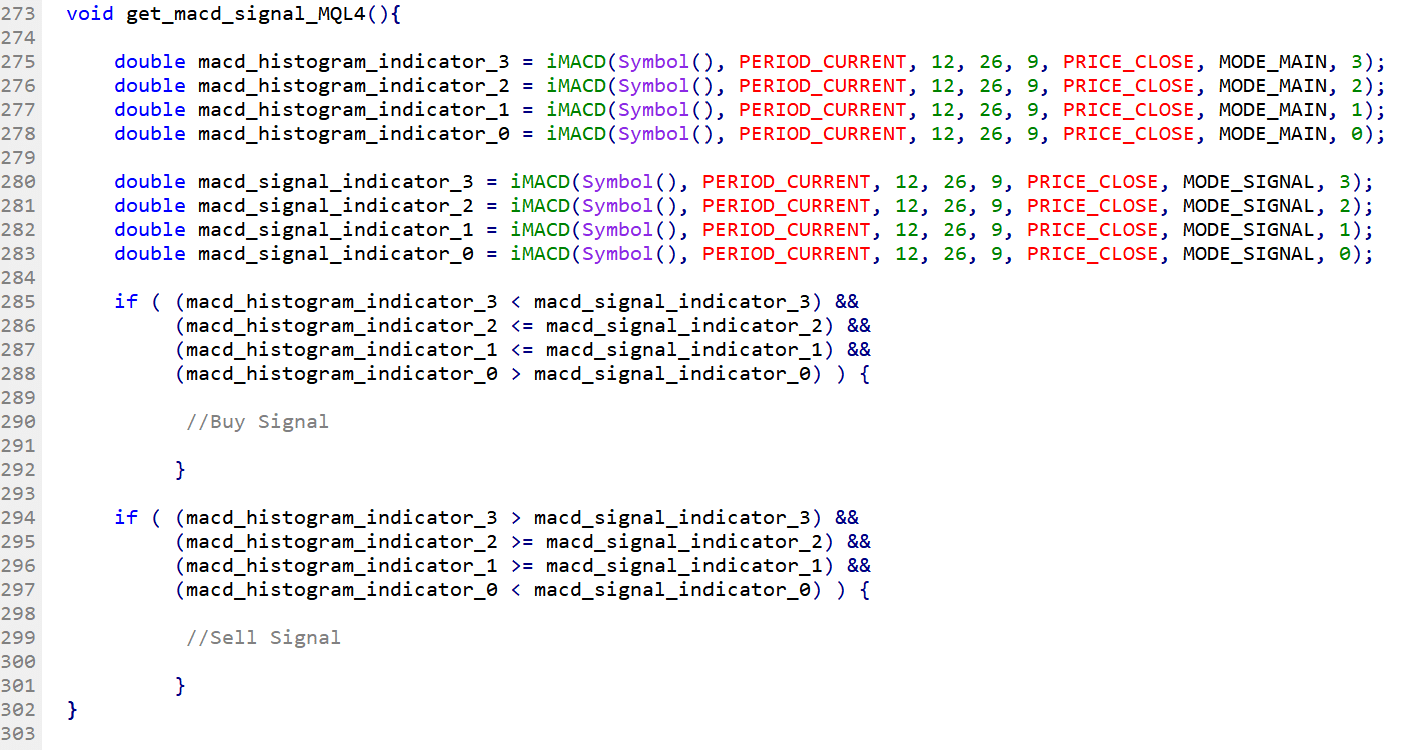
Fig.258 MACD signal in MQL4