The Relative Strength Index, or RSI, is one of the most popular momentum indicators that indicates the extent of price changes to determine overbought and oversold conditions. This technical indicator is used to identify the market context of the underlying traded instrument.
The RSI reflects the current and historical strength and weakness by evaluating the current and the previous closing prices within a specified trading period. As a momentum oscillator, the RSI helps traders to identify the magnitude of movement and the price action velocity. The most commonly-used timeframe is the 14-period, which is quantified on a zero to hundred scale. Typically, the high and low levels are recognized above seventy for the overbought and below thirty for the oversold condition.
The RSI is computed in two parts, first by calculating the average percentage of gain and loss of the previously specified range, as demonstrated in fig.246, the average gain or loss of the last 14-period. The second part of the formula is smoothing the result of the first part calculation to fit the data into a zero to hundred scale.
Part 1.

Part 2.

Fig.246 Relative Strength Index formula
There are various approaches to interpret the RSI indicator. In this guide, we will go through the most сommon methods to identify potential entry and exit signals, the reverse overbought/oversold, and the divergence. We will also develop and guide you through the process of storing the data points and retrieve them to build a trading strategy with the Relative Strength Index.
MQL4 RSI function retrieves the indicator’s data point directly. On the other hand, MQL5 requires the data to be initialized and stored in the global cache attributing it to a declared “double type” array. It may appear a bit confusing at first sight, but it is not that complicated. We will go into the details step by step for this MQL5 particularity. Finally, we will illustrate a practical example of usage with code ready to be used.
How does the RSI indicator work?
Before we dive into the details of the Relative Strength Index indicator code implementation, let us illustrate the most prevalent trend-following and reversal buy and sell signals interpretation. There are various ways to decode the RSI indicator. We will highlight the two most popular RSI patterns, the RSI overbought/oversold and the RSI divergence.
Buy signal
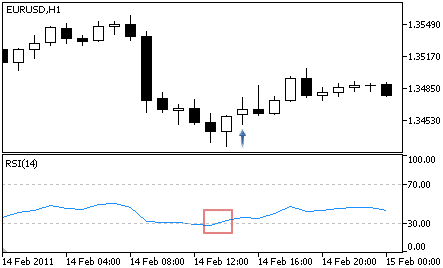
The “RSI oversold” signal is one of the most recognized signals in the investment and trading world. It happens when the oscillator turns upward from under to above the 30-level.
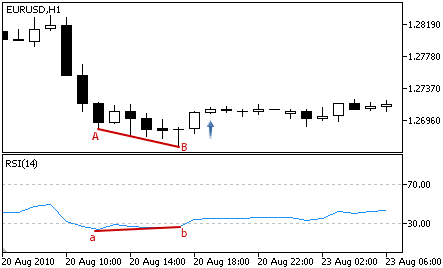
The “RSI divergence” buy signal occurs when the indicator line reverses from a downtrend to an uptrend while the underlying price continues sliding. Typically, a divergence between the RSI and the price indicates an imminent price rise.
Sell signal
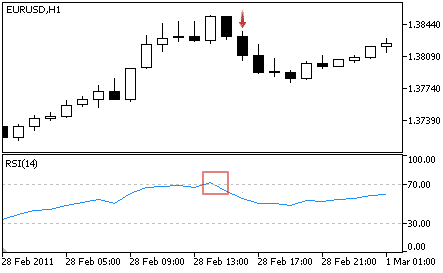
The “RSI overbought” signal arises when the indicator line crosses below the overbought level. The overbought signal suggests exhaustion from a bullish momentum and that a trend reversal may occur shortly.
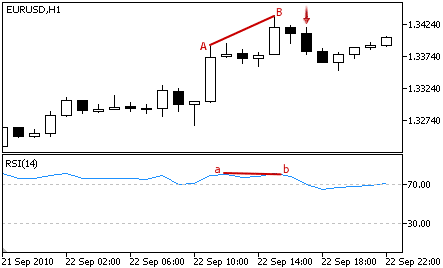
The “RSI divergence” sell signal happens when the indicator line is trending down while the underlying price continues to exhibit upside momentum. Usually, this pattern anticipates an imminent price reversal.
How does the RSI indicator store its data points?
The MQL5 RSI indicator keeps its data point in a global cache which is a dynamic array that is the indicator buffer. The size of the array is automatically controlled by MetaTrader and initialized when the Expert Advisor loads. An indicator buffer is a time-series array. As such, it has the particularity of reverse indexing. It means that the array is sorted in descending order where the latest data point is on the left side of the array. A time-series is used to store historical data and comprise the time information.
Therefore, the time-series element with index zero contains the latest quote of a symbol. For instance, an indicator on the daily timeframe will have the current oscillator bar at index zero and yesterday’s data at the position index one (Fig.247).
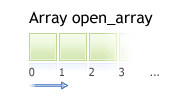
Fig.247 Indicator data points array
MQL5
To access the Relative Strength Index indicator data, MQL5 requires the use of the CopyBuffer() function. This approach does not apply to MQL4 as the MQL4 indicator function directly provides the value of the RSI data point instead of the indicator handle. The indicator handle is a sort of address to locate the data in the MetaTrader global cache. To initialize the RSI indicator data, the following parameters should be provided to the CopyBuffer() function:
- Specify the handle that is returned by the iRSI() function.
- Provide the buffer number. You may provide zero as the default value.
- Provide the start position. You may provide zero to retrieve from the most recent data point. This number represents the index where zero is the most recent data point, and one is the previous data point.
- Specify the number of data points to get from the iRSI() function.
- Provide the variable where the data will be stored. The variable must be a double type.
How to retrieve the RSI indicator data with the CopyBuffer() function?
- Declare a variable for the handle: int IndicatorHandle = iRSI();
- Declare a variable to store indicator data: double rsi_indicator;
- Copy the data to the indicator variable and retrieve data points:
- CopyBuffer(IndicatorHandle, 0, 0, 100, rsi_indicator);
- Retrieve the RSI data point with rsi_indicator[0], rsi_indicator[1].

Fig.248 CopyBuffer() Function
How to access the indicator data?
MQL4
The iRSI() function will return the indicator data point values according to the following parameters:
- The symbol of the traded instrument. You may provide a string such as “EURUSD” or use the function Symbol() to retrieve the symbol from the chart where the Expert Advisor is attached to.
- Provide the time frame using the enumeration value from the constant ENUM_TIMEFRAMES, for instance:
- PERIOD_CURRENT, for the current timeframe from the chart,
- PERIOD_M1, for the one-minute timeframe,
- PERIOD_D1, for the daily timeframe.
- Specify the averaging period to compute. The default value is 14-period.
- Specify the applied price for the calculation with the enumeration value from the constant ENUM_APPLIED_PRICE, for instance:
- PRICE_CLOSE, for close price
- PRICE_OPEN, for open price
- PRICE_HIGH, to use the highest price data
- PRICE_LOW, to use the lowest price data
- Provide the index of the indicator buffer where zero is the latest data point and one the previous data point.

Fig.249 MQL4 RSI function
MQL5
When calling iRSI(), the function will create the Relative Strength Index indicator in the MetaTrader global cache and returns its handle according to the following parameters:
- The symbol of the traded instrument. You may provide a string such as “EURUSD,” or you can use the function Symbol() to get the symbol from the chart where the Expert Advisor is attached to.
- Provide the time frame of the data point to extract using the enumeration value from the constant ENUM_TIMEFRAMES:
- PERIOD_CURRENT, to get data points from the current timeframe from the chart to which the Expert Advisor is attached.
- PERIOD_M1, for the one-minute timeframe.
- PERIOD_D1, for the daily timeframe.
- Specify the averaging method. The default value is 14-period.
- Specify the applied price for the calculation with the enumeration value from the constant ENUM_APPLIED_PRICE, for instance:
- PRICE_CLOSE, for close price.
- PRICE_OPEN, for open price.
- PRICE_HIGH, to use the highest price data.
- PRICE_LOW, to use the lowest price data.
Note that to retrieve data points from the iRSI() function, you need to use it in combination with the function CopyBuffer().

Practical case
MQL5
Fig.251 demonstrates the use of the Relative Strength Index indicator in MQL5 to create buy and sell signals with the oversold/overbought approach.
Line 195: Declare the indicator handle and assign iRSI() function handle with the specified parameters. For this example, we will provide the default settings of the 14-period.
Line 196: Declare the indicator “double type” array to store the iRSI() indicator data points.
Line 199: Copy the latest hundred data points into the indicator array rsi_indicator.
Line 202 – 214: IF statement to identify the RSI oversold and overbought pattern. The first IF block captures the RSI oscillator line movement of an overbought pattern. If the previous data points are above the 70-level and move below this threshold, a sell signal is recognized — the second IF block captures the RSI oversold pattern. An oversold condition is when the RSI oscillator line is below the 30-level and moves above this threshold.
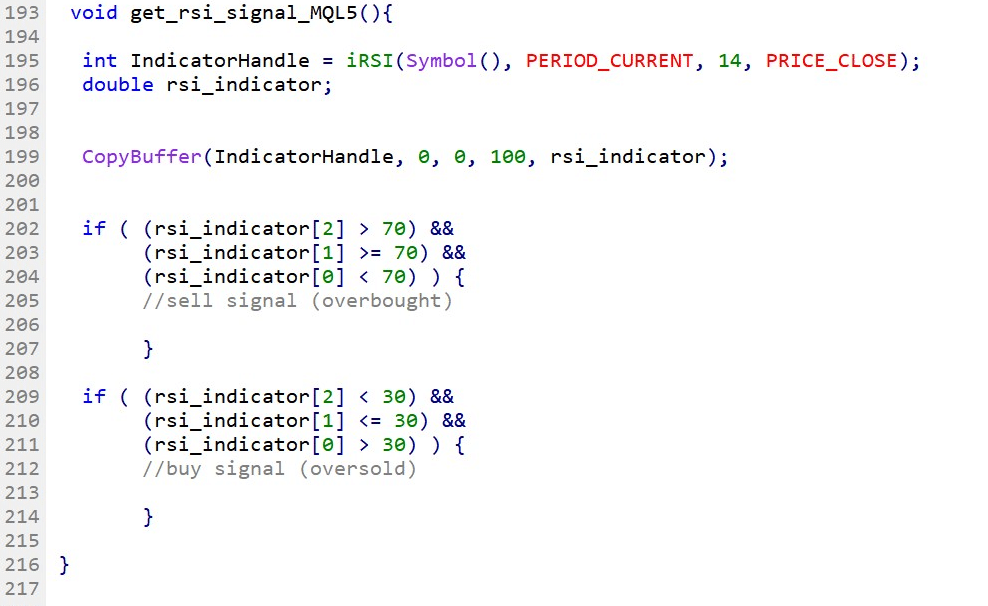
Fig.251 RSI oversold/overbought signal in MQL5
MQL4
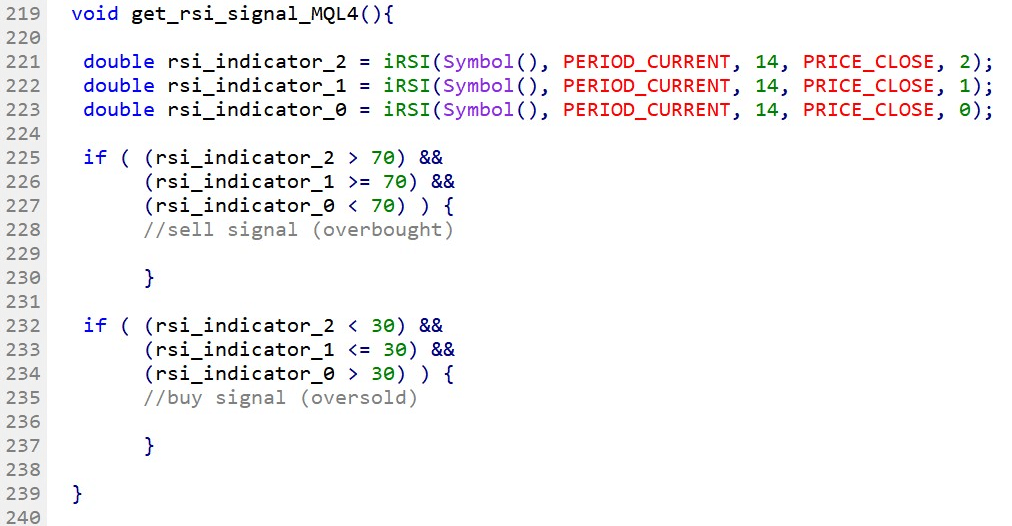
Fig.252 exhibits the use of the Relative Strength indicator in MQL4 to create buy and sell signals with the oversold/overbought approach.
Line 221 – 223: Declare the variables that will store each of the RSI data points, the two previous data points, and the latest data point by assigning the value from the iRSI() function. Note that the last parameter from the iRSI() function is the index of the oscillator data point to retrieve where zero is the most recent data.
Line 225 – 237: IF statement to identify the RSI oversold and overbought conditions. The first IF block captures the RSI oscillator line movement of an overbought pattern. If the previous data points are above the 70-level and move under this threshold, a sell signal condition is met — the second IF block captures the RSI oversold condition. The RSI is considered “oversold” when the RSI oscillator line moves from below the 30-level to above.
