The standard deviation (StdDev) is a statistical measure that allows traders to gauge the volatility of a traded instrument. It simply measures how prices are dispersed from the average price within a period. In the case that the traded instrument is trading in a narrow range of price, the standard deviation will likely return a small value which indicates low volatility. On the other hand, if the underlying instrument exhibits a reckless and wide price swing, the standard deviation will likely return a high value indicating a peak in volatility.
The standard deviation or StdDev is computed in three parts. The first calculation involves the sum of all the data points divided by the number of data points within the specified period. The default standard deviation period in MetaTrader 4 and MetaTrader 5 is twenty. The first part determines the mean value. The second part involves the subtraction of the mean from each data point within the selected period to define the variance. And finally, the third part is the square root of the variance, which will determine the standard deviation.
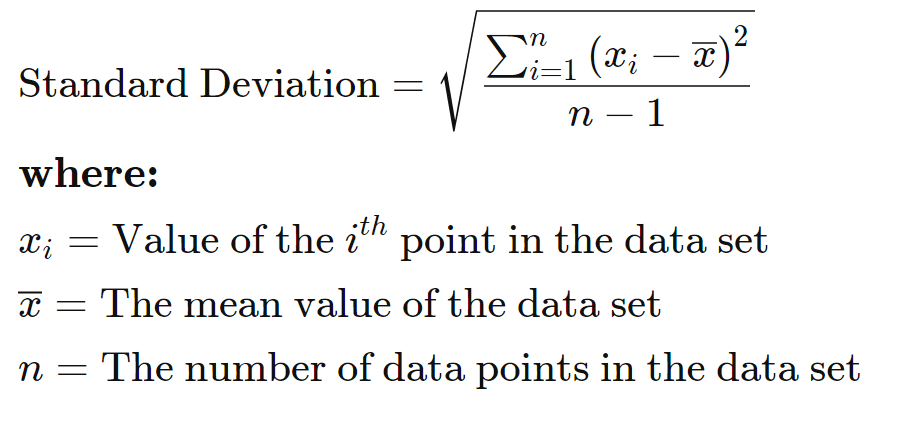
Fig.259 Standard Deviation formula
The Standard Deviation is not precisely a trading indicator in the traditional sense as it can not be used to produce buy and sell signals. However, it is an excellent indicator when it is combined with moving averages or with oscillators, such as the RSI or MACD.
In this guide, we will walk you through one of the methods to produce signals combining the standard deviation indicator with the RSI. The RSI indicator will identify potential entry and exit signals, while the standard deviation will help to set stop loss and target price levels. We will also develop and guide you through the method to store the data points and how to retrieve them to build a trading strategy with the RSI and the standard deviation indicator.
MQL4 StdDev function retrieves the indicator’s data point directly. Conversely, MQL5 requires the data to be initialized and to be stored in the global cache before being attributed to a declared “double type” array. It seems a bit confusing, but it is actually not. We will go into the details step by step for this MQL5 specific feature. Finally, we will illustrate a practical example of usage with code ready to be used.
How does the Standard Deviation indicator work?
Before we dive into the details of the Standard Deviation indicator code implementation, let us explain to you how to read the indicator. The StdDev indicator is represented by a line which is the deviation value in price. When the line rises, it symbolizes that prices are becoming more volatile. As the price moves back to its mean and an asset trades in a narrow range, the standard deviation heads lower. A spike in the standard deviation signifies a surge in price volatility, while a lower reading suggests low volatility.
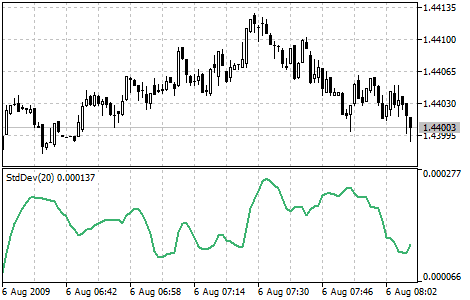
Fig.260 Standard Deviation Indicator
How does the Standard Deviation indicator store its data points?
The MQL5 StdDev indicator keeps its data point in a global cache which is a dynamic array that is the indicator buffer. The size of the array is managed by MetaTrader and initialized when the Expert Advisor loads. An indicator buffer is a time-series array; as such, the indexing is reversed. It means that the array is sorted by descending where the latest data point is on the left side of the array. A Time-series is used to store historical data and comprise the time information.
Therefore, the time-series element with index zero contains the latest quote of a symbol. For instance, an indicator on the daily timeframe will have the current oscillator bar at index zero and yesterday’s data at the position index one (Fig.261).
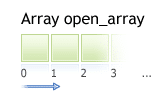
Fig.261 Indicator data points array
MQL5
To access the Standard Deviation indicator data, MQL5 requires the use of the CopyBuffer() function. This approach does not apply to MQL4 as the MQL4 indicator function directly provides the value of the StdDev data point instead of the indicator handle. The indicator handle is a sort of address to locate the data in the MetaTrader global cache. To initialize the StdDev indicator data, the following parameters should be provided to the CopyBuffer() function:
- Specify the handle that is returned by the iStdDev() function
- Provide the buffer number. You may provide zero as the default value.
- Provide the start position. You may provide zero to retrieve from the most recent data point. This number represents the index where zero is the most recent data point, and one is the previous data point.
- Specify the number of data points to get from the iStdDev() function.
- Provide the variable where the data will be stored. The variable must be a double type.
How to retrieve the Standard Deviation indicator data with the CopyBuffer() function?
- Declare a variable for the handle: int IndicatorHandle = iStdDev();
- Declare a variable to store indicator data: double stddev_indicator;
- Copy the data to the indicator variable and retrieve data points
- CopyBuffer(IndicatorHandle, 0, 0, 100, stddev_indicator);
- Retrieve the StdDev data point with stddev_indicator[0], stddev_indicator[1].

Fig.262 CopyBuffer() Function
How to access the indicator data?
MQL4
The iStdDev() function will return the indicator data point values according to the following parameters:
- The symbol of the traded instrument. You may provide a string such as “EURUSD” or use the function Symbol() to retrieve the symbol from the chart where the Expert Advisor is attached.
- Provide the time frame using the enumeration value from the constant ENUM_TIMEFRAMES, for instance:
- PERIOD_CURRENT, for the current timeframe from the chart,
- PERIOD_M1, for the one-minute timeframe,
- PERIOD_D1, for the daily timeframe.
- Specify the averaging period to compute. The default value is 20-period.
- Specify the moving average shift.
- Provide the averaging method with the enumeration value from the constant ENUM_MA_METHOD, for instance:
- MODE_SMA, for the “simple averaging,”
- MODE_EMA, for the “exponential averaging,”
- MODE_SMMA, for the “smoothed averaging,”
- MODE_LWMA, for the “linear-weighted averaging.”
- Specify the applied price for the calculation with the enumeration value from the constant ENUM_APPLIED_PRICE, for instance:
- PRICE_CLOSE, for the close price,
- PRICE_OPEN, for the open price,
- PRICE_HIGH, to use the highest price data,
- PRICE_LOW, to use the lowest price data.
- Provide the index of the indicator buffer where zero is the latest data point and one the previous data point.

Fig.263 MQL4 RSI function
MQL5
When calling iStdDev(), the function will create the Standard Deviation indicator in the MetaTrader global cache and returns its handle according to the following parameters:
- The symbol of the traded instrument. You may provide a string such as “EURUSD” or use the function Symbol() to retrieve the symbol from the chart where the Expert Advisor is attached to.
- Provide the time frame using the enumeration value from the constant ENUM_TIMEFRAMES for instance:
- PERIOD_CURRENT, for the current timeframe from the chart,
- PERIOD_M1, for the one-minute timeframe,
- PERIOD_D1, for the daily timeframe.
- Specify the averaging period to compute. The default value is 20-period.
- Specify the moving average shift.
- Provide the averaging method with the enumeration value from the constant ENUM_MA_METHOD, for instance:
- MODE_SMA, for the “simple averaging,”
- MODE_EMA, for the “exponential averaging,”
- MODE_SMMA, for the “smoothed averaging,”
- MODE_LWMA, for the “linear-weighted averaging,”
- Specify the applied price for the calculation with the enumeration value from the constant. ENUM_APPLIED_PRICE for instance:
- PRICE_CLOSE, for close price
- PRICE_OPEN, for open price
- PRICE_HIGH, to use the highest price data
- PRICE_LOW, to use the lowest price data
Note that to retrieve data points from the iStdDev() function, you need to use it in combination with the function CopyBuffer().

Fig.264 MQL5 RSI function
Practical case
MQL5
Fig.265 demonstrates the use of the Standard Deviation indicator in MQL5 to set an appropriate stop loss and target price based on the market volatility from the last 20-period. The StdDev indicator is used in combination with the RSI indicator to spot overbought and oversold opportunities.
Line 4: Declare the Standard Deviation indicator handle and assign the iStdDev function handle with the specified parameters. For instance, we provide the default 20-period.
Line 5: Declare the indicator “double type” array to store the iStdDev() data points.
Line 7: Declare the indicator handle and assign the iRSI() function handle with the specified parameters. For this example, we will provide the default settings of the 14-period.
Line 8: Declare the indicator “double type” array to store the iRSI() indicator data points.
Line 11: Copy the latest hundred RSI data points into the indicator array rsi_indicator.
Line 12: Copy the latest hundred StdDev data points into the indicator array stddev_indicator.
Line 14 – 15: Declare the stop loss and target price variables.
Line 17 – 33: IF statement to identify the RSI oversold and overbought pattern. The first IF block captures the RSI oscillator line movement of an overbought pattern. If the previous data points are above the 70-level and move below this threshold, a sell signal is recognized.
The second IF block captures the RSI oversold pattern. An oversold condition is when the RSI oscillator line is below the 30-level and moves above this threshold. Stop loss and target price levels are set according to the market volatility defined by the standard deviation of the last 20-period. The applied risk/reward ratio is set to 1:2, as attested by the stop loss set at half of the standard deviation value, while the target price is equivalent to the current standard deviation.
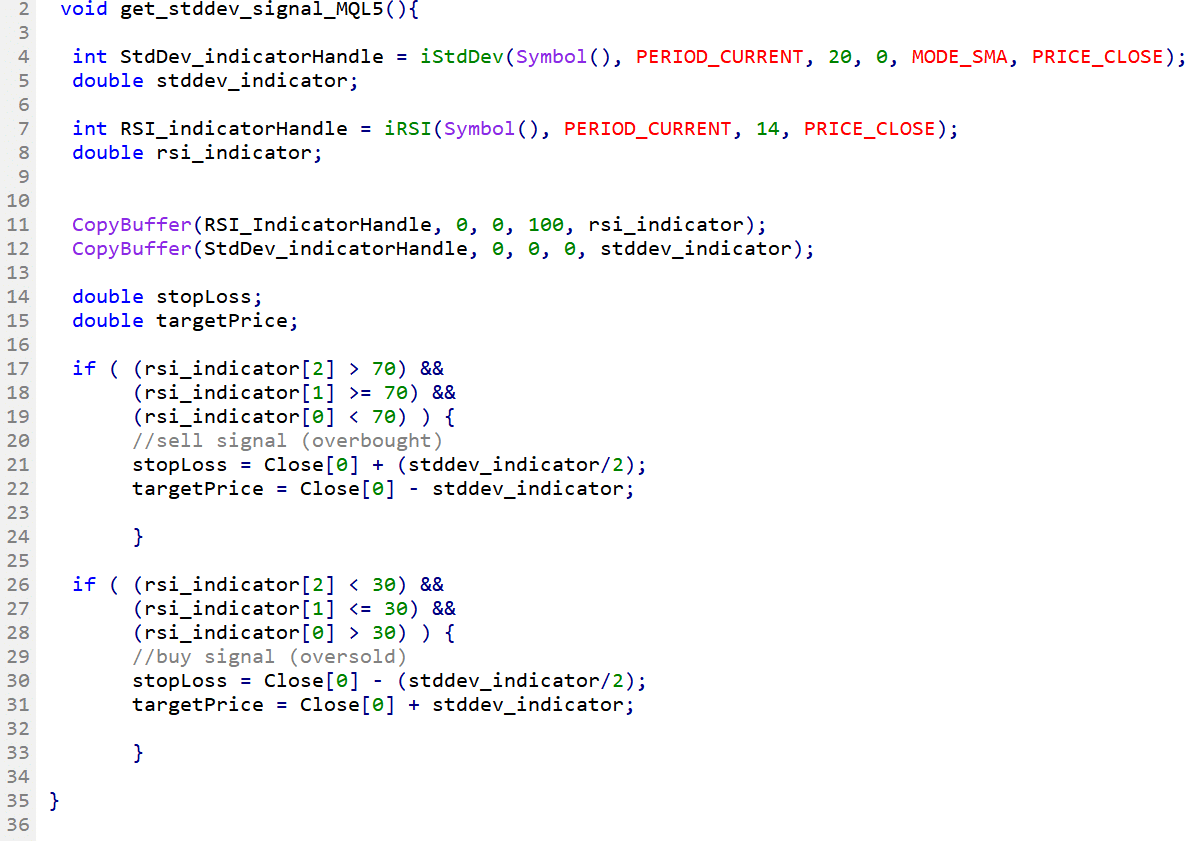
Fig.265 RSI oversold/overbought signal combined with StdDev stop loss and target price in MQL5
MQL4
Fig.266 exhibits the use of the Standard Deviation indicator in MQL4 to set an appropriate stop loss and target price based on the market volatility from the last 20-period. The StdDev indicator is used in combination with the RSI indicator to identify overbought and oversold opportunities.
Line 40: Declare the variable that will store the last standard deviation data point. Assign the most recent data point returned from the function iStdDev().
Line 42 – 44: Declare variables that will store RSI the last three most recent data points. Variables are assigned the value from the function iRSI().
Line 46 – 47: Declare the stop loss and target price variables.
Line 50 – 66: The IF statement is to identify the RSI oversold and overbought pattern. The first IF block captures the RSI oscillator line movement of an overbought pattern.
If the previous data points are above the 70-level and move below this threshold, a sell signal is recognized. The second IF block captures the RSI oversold pattern. An oversold condition is when the RSI oscillator line is below the 30-level and moves above this threshold. Stop loss and target price levels are set according to the market volatility defined by the standard deviation of the last 20-period. The applied risk/reward ratio is set to 1:2, as attested by the stop loss set at half of the standard deviation value, while the target price is equivalent to the current standard deviation.
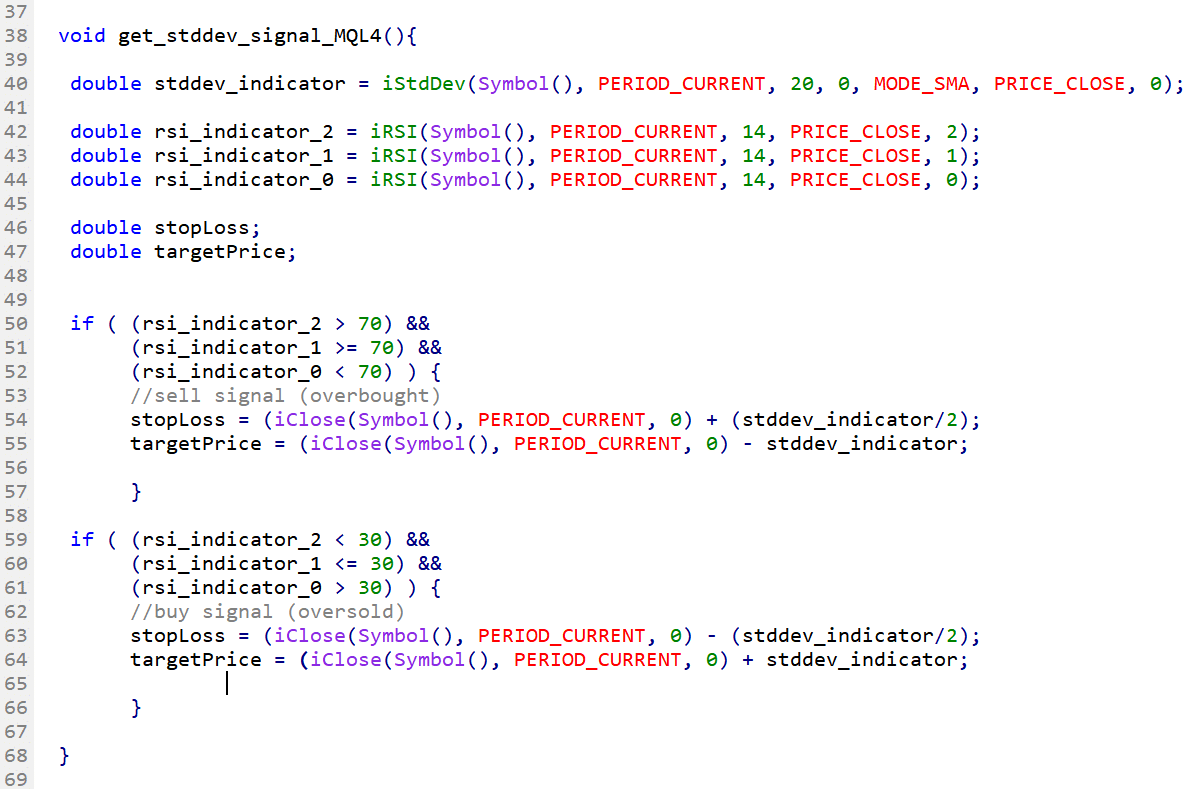
Fig.266 RSI oversold/overbought signal combined with StdDev stop loss and target price in MQL4