What is MACD
MACD, or Moving Average Convergence Divergence, is one of the simplest forex indicators that show the connection between the two moving averages of security’s price. By deducting the longer moving average from the smaller moving average, it basically turns these trend-following indicators into an oscillator.
As such, the resultant momentum oscillator is both a trend seeking and momentum indicator. As the moving averages diverge, converge, and cross, it swings over and under the zero line.
By looking for such crossovers and divergences, traders can generate signals and automatize their trading. However, since the indicator is not bounded, it is not as useful for recognizing overbought and oversold levels. MACD is particularly useful for trading robots to spot changes in the direction, momentum, duration, and strength of a stock price trend.
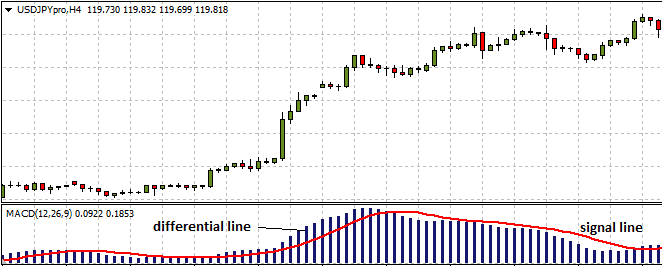
The trend strength indicator consists of a Differential Line and Signal Line. The Signal Line is just a signal moving average (9EMA) of the values of the Differential Line. On the other hand, the Differential Line marks the variation between two exponential moving averages. By default, these are 12-period and 26-period EMAs, which are the short and long term respectively. This is the reason why 12, 26, 9 are the default MACD indicator settings.
History of MACD
It was Gerald Appel that invented the MACD in the 1970s. Later on in 1986, as a means to anticipate the oscillator-crossover, Thomas Aspray added a histogram to the MACD, which has since become a fundamental part of the indicator.
The reason why the most common values used are 12, 26, and 9 days is because when it was founded there weren’t any trading platforms that showed the changing prices every moment the way modern platforms do today. Since the working week used to be of 6 days, the period settings represent 2 weeks (12 days), 1 month (26 days), and one and a half weeks (9 days).
Though with the current 5-day trading period, the possibilities of altering the period settings cannot be denied, it is better to stick to the period settings. This is because the buying and selling decisions for most traders, and trading robots are still based on the standard settings.
How MACD can be adjusted and how is it useful for traders
Traders are free to adjust the MACD settings at their discretion. This can be profitable since most of the automated trading software is following the same cues as provided by these indicators. Instead of following the crowd, a wise trader can adjust the settings as s/he sees fit.
Finding out how the trend is moving over other time periods and in other contexts can be of special value as well. For instance, a trader can consider utilizing the settings 5, 42, 5. When using daily charts, the fast EMA is set to a week’s data, the slow EMA is set to two months’ data, and the EMA of the signal line is set to five periods.
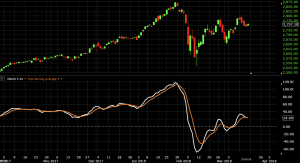
The setup becomes more responsive to a price change if there is a wider difference between the fast and slow EMAs. Furthermore, faster and frequent signal line crossovers will be created with the use of shorter EMA of the MACD series. Such a setting is shown below:
By rule, the shorter the EMA is, the closer it is to the approximation of the MACD series. If the EMA is set to a single period, it will be exactly equal to the MACD series. Such precision is shown below:
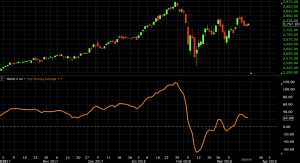
Such an option is ideal for those who want to utilize the MACD series only. For this purpose, the signal line setting should be set to either 1 or 0, the former covering the MACD series and the latter being non-existent.
Basic strategies using MACD
With standard settings, let us discuss how to read the MACD with the aid of the chart given below:
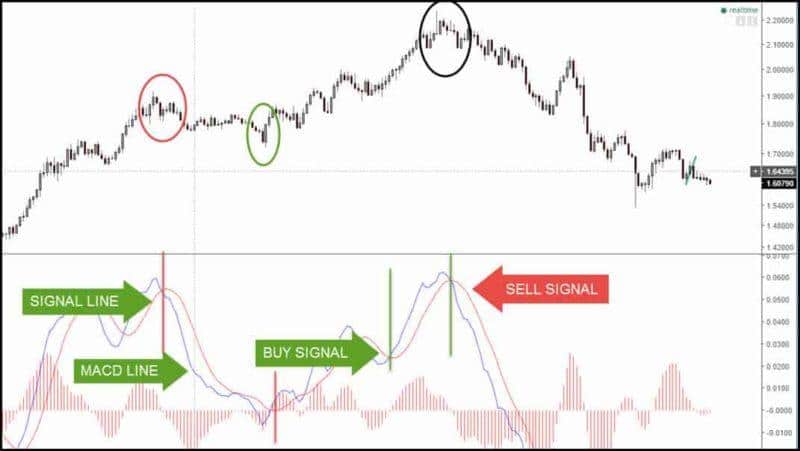
When determining the trend direction with the MACD, identify where the MACD line is with respect to the signal line. We are looking for a short trade if the MACD line is below the signal line.
On the other hand, if the MACD line is above the signal lines, it indicates an upward trend of the market and one can be bullish on any trading setup.
- Buy crosses of the 2 lines if the MACD is above the 0 line.
- Look to sell the crossing of the slow and fast line.
- When there is a cross between the opposite directions of the two lines, trade exit.
This is why multiple time-frame trading is suited to MACD. Look to buy pullbacks during a MACD uptrend and short rallies during the downtrend.
Entry and Exit Signals
Many traders buy or sell the market using the MACD signal line. In conjunction with trading a simple cross, you should also look for other variables, such as price action, structure, and multiple time frames.
When the MACD line crosses past the signal line on the downside, you would be bearing and can be used as a sell signal. On the other hand, if it crosses to the upside, it would be a bullish move and can be used as a buy signal.
Zero Line Trading Strategy
One can also take advantage of the zero and the fast line for trade entry. Once again, consider the lag of all indicators and think of using multiple time frames.

With the chart above, one can see the trend change during the moving average crossover and know that we are looking for short trades. It would be trade entry as soon as the fast line crosses the zero line.
According to the daily chart above, the red line is indicative of where you would enter on the chart using this strategy.
Taking the Long View
The stock is in a position to enter an order when we have a rising 26-week EMA, an increasing MACD histogram on weekly charts, and slow Stochastics that is moving below 30 on daily charts (as is given in the table below).
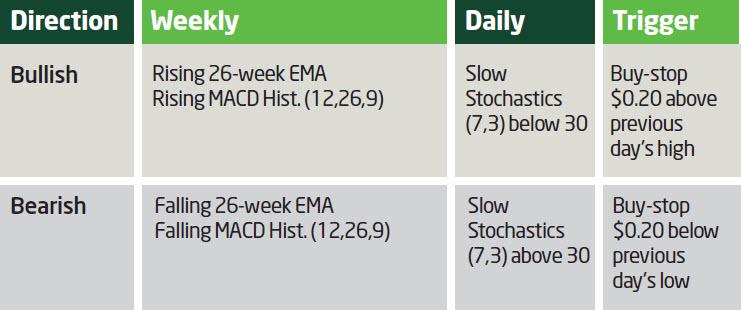
The trader can have a buy-stop order, for instance of $0.20 over the previous day’s high, to pull the trading trigger. Also, a protective stop can be placed initially 1-3% lower than the previous entry.
As mentioned before, the system can be further refined by improving its accuracy through the inclusion of chart pattern analysis, other indicators, fundamental analysis of the market, and support and resistance levels.
The Bottom Line
MACD is one of the most popular forex indicators amongst traders and analysts. With this trend strength indicator, traders can learn how to use and adjust trading robot:
- To determine 2-line cross trends
- To read momentum using fast line
- Trade entry using fast line
- Trade entry using zero line
- The benefits associated with multiple time frame analysis
As is the case with other forex indicators, you want to use MACD as a part of an overall trading algorithm. Always be aware of the lag time that comes with this indicator, even though it is an advantage for some forex robot systems that are not picking either the tops or bottoms.