Wondering how to gauge the strength of an asset’s price changes? Momentum Indicators have got your back! There are a variety of indicators that can help you analyze the momentum to make better trading decisions. Read further to understand what Momentum Indicators are and how you can use them to understand the market better.
Momentum Indicators (MI) Defined –
In trading, momentum refers to the ‘degree of aggressiveness’ of the market. A powerful tool for technical market analysis, momentum indicators measure the rate at which the price of an asset rises or declines. Investors can use the MI lines on a price chart to gauge the speed or duration of time during which the price of a security fluctuates.
The momentum indicator can be calculated as –

The MI compares the most recent or current closing price (CP) to a prior closing price (CPn) within a given time frame (n).
Momentum indicators help traders identify points at which the market may show reversals by picking on the divergence between movement of price and the momentum. The indicator can help analyze trade signals based on the strength of the movement of the trend. A declining MI signifies exhaustion of the market or the possibility of a market reversal, whereas an accelerating MI indicates a strong trend that is likely to persist.
Momentum indicators can be used to confirm the validity of trades based on price actions such as pullbacks or breakouts. For example, when a stock shows positive momentum, it indicates the buyers to purchase stocks and you may observe an aggressive buying trend. For the forex market, the momentum indicator can predict a trend before it actually takes place, therefore it is a leading indicator.
Momentum indicators are best used in conjunction with other tools such as trend lines or various kinds of moving averages. This is because MI only shows the speed or relative strength of change in stock prices and does not display the direction of movement. MI points out towards three primary signals – the moving average cross, the 100 line cross and the divergence signal.
Types of Momentum Indicators –
Momentum indicators generate signals that point out if the asset is oversold or overbought. Some such indicators are explained below:
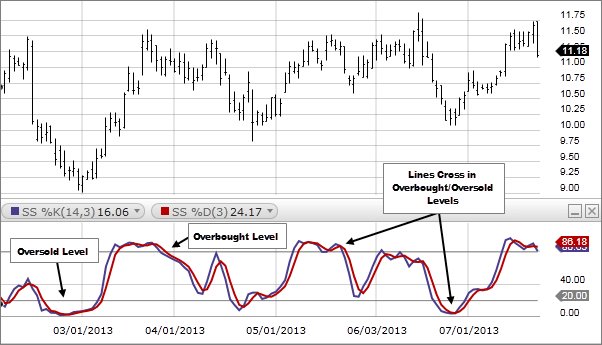
- Stochastic Oscillator (SO) – Constructed in the 1950’s by Dr. George Lane, Stochastic Oscillator is used to depict the level of closing prices in accordance with the high-low range over a specified time period. The idea behind SO is that the asset’s price will approach an extreme limit before turning around. It uses resistance and support levels to predict the turning points in the priceline.
The SO is calculated as %K that measures the current close to the recent low, divided by the difference between the range of the previous period.
The formula for SO is –

where,
C: Current Price.
L: Lowest price over a time period.
H: Highest price over a time period.
N: Defined period of time.

The SO is bound between 0-100 levels. The rule of thumb is that a reading lower than 30 signals that the asset is oversold and a reading above 80 is considered overbought. The SO is sensitive to the movements of the market, the sensitivity can be reduced by averaging the price points i.e. by taking a 3-day moving average, %D.

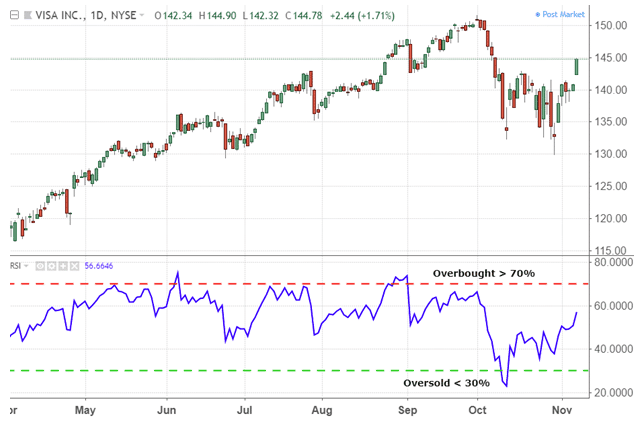
- Relative Strength Index (RSI) – Developed by W. Wilder, the RSI is an oscillator that spots price changes and signifies the speed at which this change in price takes place. The RSI is used to pin-point the possibility of reversal in trends and identify the strength of a trend at a particular point of time.

The value of RSI varies between 0-100. A value less than 30 signifies an oversold situation. A value above 50 shows an upwards trend momentum and if it surpasses 70, it indicates a situation where the asset is overbought. The higher the reading, the faster the price changes.


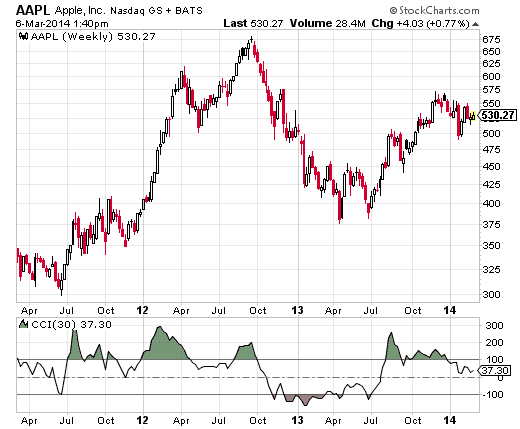
- Commodity Channel Index (CCI): Another common measure of momentum is the Commodity Channel Index, which was developed by Donald Lambert. It is calculated as the current price minus the historical average price level during a specific time period. The CCI is an unbound indicator, it can stretch on either side indefinitely.

Like other measures of momentum, traders use this indicator to spot emerging trends in the following way –
-
- If the CCI is below 100, this spells a strong downtrend.
- If the CCI reads 100 or above, it means that the price is above the average and signals a strong uptrend.
- As the trend moves briskly from near zero to exceed 100, it signals an emerging uptrend.
- Investors can look out for a pullback followed by a buying opportunity. As the CCI moves the other way round, it may spell an emerging downtrend and can be treated as a signal to watch out for opportunities to short
- As the price moves up while the indicator falls, it means that there is divergence, signalling a weak trend. This may work as a warning for a trend reversal – it is advised to put off new trades in the direction of price trend or strengthen the stop losses.
Final Thoughts
As a trader you can use the various momentum indicators to confirm price action. However, experts also assert that the momentum indicators don’t provide much information beyond what can already be seen by looking at the price chart. They are still useful for spotting subtle price shifts in the buying or selling forces by using divergence. An enterprising trader will try to get a comprehensive understanding of the market scenario before making use of the momentum indicator as an absolute signal for trend reversal.