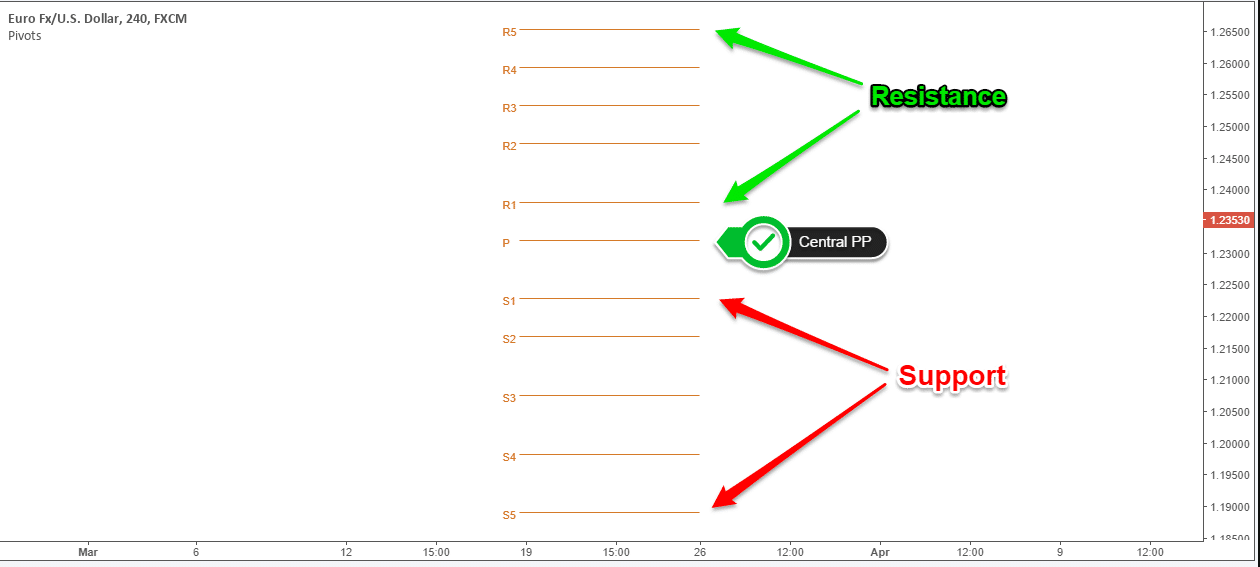
Pivot points (PP) are some of the most-watched levels in the forex and other liquid markets as they signify levels of strong support and resistance levels. They act as potential turning spots from where bias can change from bullish to bearish and vice versa.

Therefore, people pay close watch to these levels as they signify a change in market sentiments. In addition, they provide ideal levels for entering long and short positions or show where stop or profit take orders should be placed.
The fact that thousands of people pay close watch to these turning spots makes them ideal for position or swing trading.
How they are calculated
The availability of a pivot indicator makes it easy to plot potential turning spots in the chart. The indicator calculates them by simply leveraging the high low, and close of a given period.
Therefore the PP = (High +Low + Close)/3
In most cases, it is calculated using the daily price. In this case, a daily high, low, and close will be added and then divided by three, giving rise to a simple average of the three.
Pivot areas are extremely powerful as they take into consideration the close of day price, regarded as one of the most important in trading. Therefore, the PP will always be more reliable for triggering entry and exit spots.
Once the pivot spot is calculated, it can be used to compute potential support and resistance areas for a given trading day. Therefore, one can compute support for different support and resistance levels.
- S1 = (P x 2) – High
- S2 = P – (High – Low)
- R1 = (P x 2) – Low
- R2 = P + (High – Low)
- R3 = H + 2 * (PP – L)
- S3 = L – 2 * (H – PP)
How to use them
People pay close watch to PP for timing entry and exits regardless of the security one is trading. However, it is important to note that at times, these levels are often characterized by too much noise, which can lead to the triggering of faulty trades.
However, PP comes in handy when determining ideal support levels from where one can enter a long position or resistance levels from where one can enter a short position. Additionally, they can be used to trade breakouts, especially after long periods of consolidation.
For instance, an asset understudy would be considered bullish if it broke above R1 and continued to edge higher. Conversely, it would be considered bearish if it breached S1 and continued to move lower on volume.
In addition, if it extended to R2 or R3, as indicated by the Pivot point indicator, there is always a likelihood of it reversing after some time. The same is true if the instrument were to edge lower significantly such that it falls towards S2 or S3 as indicated by the PP indicator; a reversal could come into play resulting in the instrument correcting higher.
Therefore, one can enter a long position at S3 as the instrument would have tanked significantly or look to enter a short position at R3 on price moving higher significantly.
Example
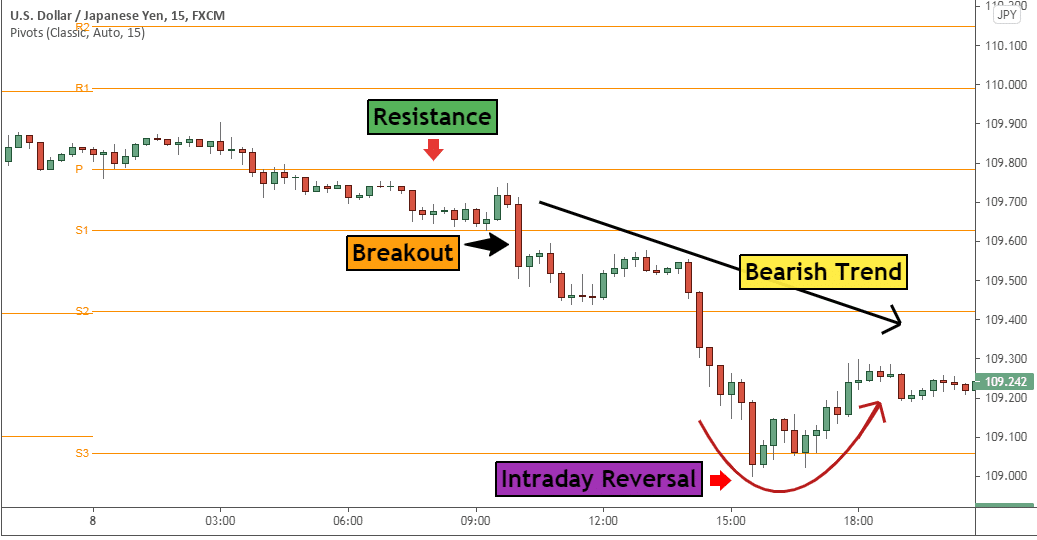
Consider the chart below, which indicates USDJPY is in a downtrend as it is well below R1, above which security is considered bullish.

Price moving lower away from the PP at 109.8 only went to signify that a downtrend has started.
Upon the pair breaking below the S1 support level, it affirmed the start of a downtrend, acting as an ideal spot for entering a short position in anticipation of additional lower lows. The instrument edged lower, breaching the S2 support level, all but affirming the strength of the downtrend.
However, as soon as USDJPY edged to the S3 support level, the bearish momentum lost some steam as traders exited the market on taking profits. The S3, in this case, is considered an oversold territory from where it corrected and started moving higher.
PP consolidation strategy
Pivot spots come in handy in day trading. For this strategy to work, an asset understudy ought to be in consolidation, oscillating between highs and lows without any directional bias. In this case, the price needs to oscillate below or above the central pivot spot.
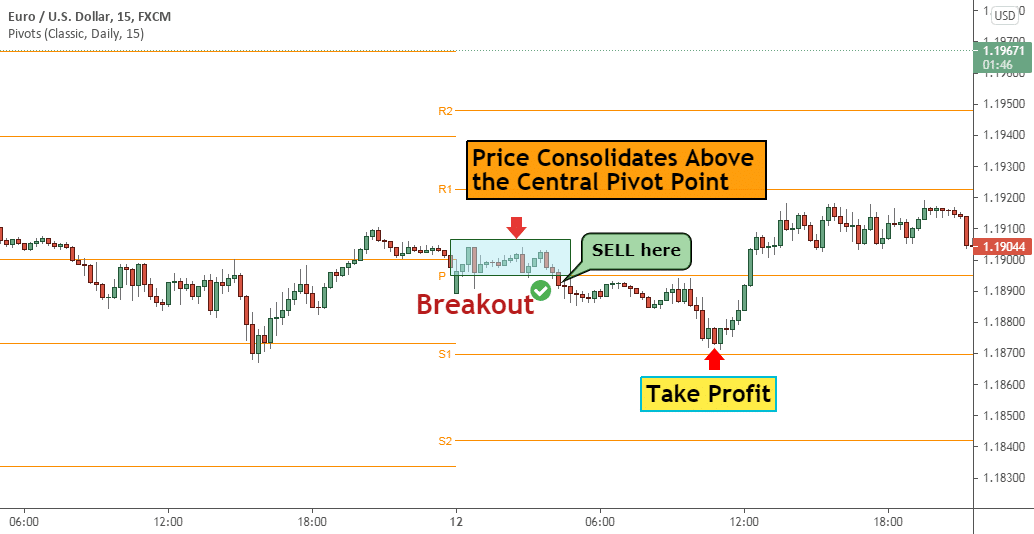
Consider the EURUSD chart below, whereby the pair consolidates above the PP as if to signify consolidation.

Once the pair broke below the PP and closed, it signified the start of a move lower, acting as a trigger for a short position towards S1, which in this case serves as a support level. Failure to breach the S1 support level and continue moving lower would act as a trigger to exit the short position and open a long position in anticipation of EURUSD correcting higher.
Tips
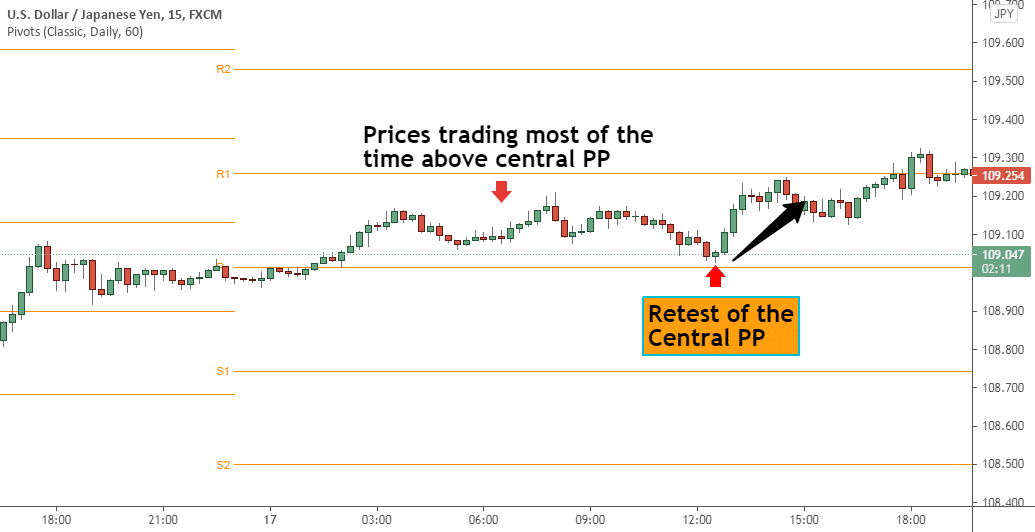
One of the best ways to leverage PP for increased profitability is to look out for potential areas of price rejection. For instance, during day trading, an instrument establishes a bullish bias by trading above the central pivot spot. It is important to wait for it to correct lower after some time and retest the PP level to confirm the upward momentum.
The USDJPY chart below clearly shows that it was trading above the Pivot Point for the better part of the day. However, after a move up, it experienced strong resistance near R1 and started moving lower.

Given the bullish bias at the start of the trading day, we expect bulls to defend PP once it corrects lower. If buyers are still in control, the price would often correct higher, this time power through the R1 resistance level.
Bottom line
Pivot points provide some of the best trade setups as they signify ideal entry and exit points. The indicator also provides excellent spots for placing take profit and stop loss orders while trading. Day traders use these levels to ascertain a change of market sentiments on price, breaching some of the key levels.