Market theories play an important role in guiding investors and traders about price action. For example, a good understanding of the Elliott Wave theory can give you a clear view of the different phases that the market is in.
Similarly, the Dow theory can give you more understanding of the performance of indices. In this article, we will look at the Wyckoff Model or Method and how you can use it well in forex trading.
What is the Wyckoff Method?
The Wyckoff Method is a popular market theory that seeks to explain the phases of the market. It was developed by Richard Wyckoff, a trader who died in 1934. He spent most of his professional life studying the different patterns in the market.
Precisely, he sought to understand market cycles and how traders can identify the stage where the market is at. He noted that the stock market tended to move in four cycles. A good understanding of these cycles can help a trader avoid some serious mistakes in the market. It can also help the trader take advantage of the different stages.
To be clear. The Wyckoff Method was not defined with forex in mind. At the time, forex trading was not even around. However, in my experience, the model can be used well in all types of markets like commodities, cryptocurrencies, and even bonds.
From a personal perspective, I applied the model relatively well in 2021 during the rise and fall of cryptocurrencies.
Wyckoff laws
Before we look at the four cycles, we will first look at the three important laws that Wyckoff specialized in.
First, there is the law of supply and demand. In his studies, he noted that demand and supply were the key drivers of movements. He summarized this by saying that a stock will always rise when there is more demand. Subsequently, it will fall when there is more supply than demand. Therefore, he advocated that traders should take time to study the imbalance between the two.
Second, the third law of the Wyckoff method is cause and effect. To understand market trends, traders need to have a good understanding of the cause of a market phenomenon and its effect. In this case, if the EURUSD pair is rising, you need to understand the cause of that movement.
Finally, he identified the law of effort versus result. This is an important law that provides potential warnings about price changes. Fortunately, today, there are several ways of identifying these warnings. They include oscillators that show bearish or bullish divergences. They also include chart patterns like triangles and rising wedges.
Using the Wyckoff theory in forex
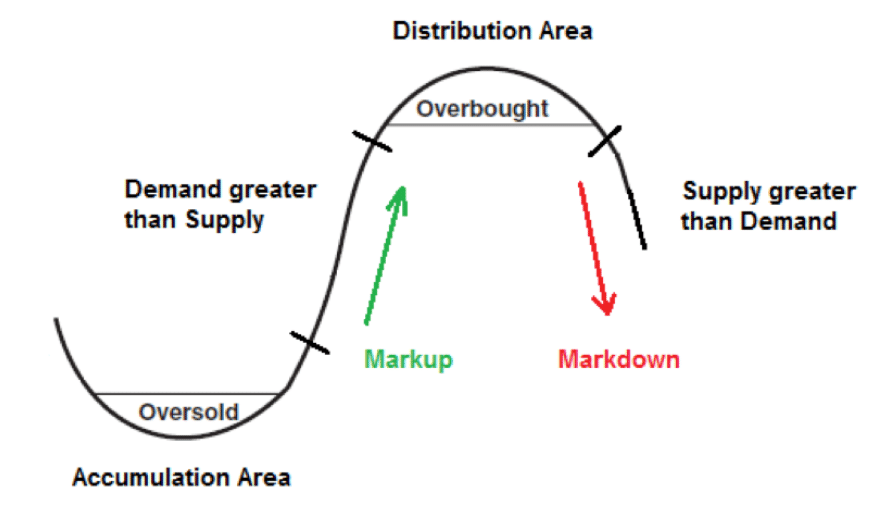
The Wyckoff theory notes that markets go through five key stages. Therefore, when you identify the stage where the market is, you can know when to buy or sell a currency pair.
The first stage is known as the accumulation phase. This is a period where the smart money is starting to buy a stock or currency pair. There are usually no major movements during this accumulation phase. And in most cases, it starts when an asset is at an oversold or overbought level.
The second stage is known as the markup. It is a period where investors identify a currency pair that is rising. As a result, because of the fear of missing out (FOMO), many other traders join in the frenzy. This period can go on for a long time. For example, during the dot com bubble, stocks were in a strong upward trend for years. The same thing happened in cryptocurrencies between January and May 2021.
The period is also usually characterized by a frenzy among traders and analysts. In it, most analysts will keep touting the rising asset.
However, no bull run in the market lasts forever. Therefore, Wyckoff identified the third stage that is known as distribution. This phase is characterized by a sluggish performance where the bullish rally starts to fade. This stage is known as distribution, and it often happens when the asset reaches the overbought level.
A closer look at this stage shows that there are several chart patterns that usually happen. For example, you can identify chart patterns like head and shoulders, double-tops, and rising wedges.

In a distribution stage, the supply exceeds the demand. This stage is known as markdown and is usually characterized by a sharp decline of the asset. These four phases are summarized in the chart above.
How to use the Wyckoff model in trading
Like other market theories, the Wyckoff model is easier said than done. It is usually relatively difficult to use it on its own. Instead, we recommend that you use it in combination with other chart patterns like head and shoulders and rising wedges. Also, using technical indicators like Moving Averages and Bollinger Bands can help.
Example of the Wyckoff theory at work
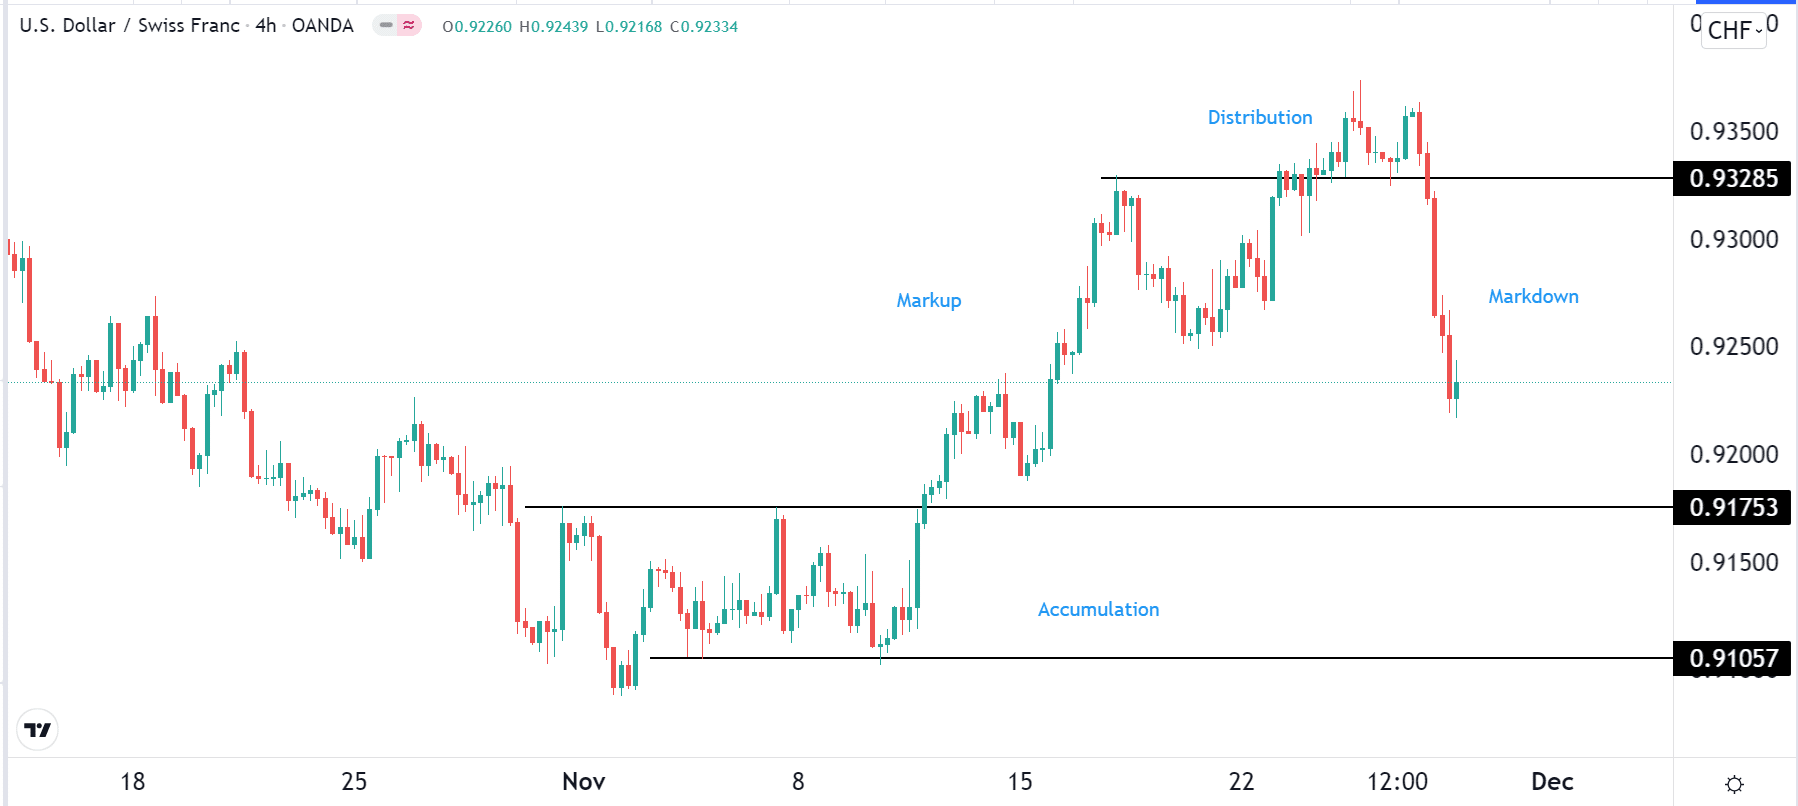
The chart below shows the Wyckoff theory at work. The USDCHF was in a consolidation phase in the first week of November. In this case, this is the accumulation stage. It then made a bullish breakout when it managed to move above the key resistance at 0.9175. The pair then moved to the distribution phase and then the markdown stage.

In this chart, we see that the markdown stage started when the pair formed a double-top pattern. In price action analysis, a double-top is usually a sign that a bearish trend will start soon.
Summary
Several market theories can help you understand what is happening. In this article, we have looked at the ancient theory that Wyckoff developed. In my experience, I have found it to be a good way to understand the different market cycles. As with all theories, it is not always perfect. This explains why it is important to incorporate other tools in the analysis.