Market sentiment refers to the general feel of the financial market. For example, when investors are buying stocks or other assets at any price can be said to be a period of irrational exuberance or euphoria. On the other hand, a period where they are selling their holdings can be said to be a period of fear. In this article, we will look at the four top sentiment indicators you can use in the financial market.
Fear and greed index
The fear and greed index is one of the most common sentiment indicators in the financial market. It is a widely used tool that combines several sentiment indicators to gauge whether investors are fearful or greedy about the market. The tool was developed by CNN Money.
The fear and greed index was developed by taking several market gauges and combining them to form a single and trackable tool. It is updated every weekday.
The gauge ranges from zero to 100. When it is below 50, the market sentiment is said to be fearful. A lower index means that there is more fear in the market. Similarly, a fear and greed index reading above 50 is usually a sign that there is more greed in the market. When it gets to 100, it means that investors have gotten substantially greedy.
The fear and greed index recently moved to the extreme fear zone of before 10 in March 2020. At the time, there were concerns about coronavirus and its impacts on corporate earnings. Before that, it dropped to below 20 in 2019 during the China-US trade war.
The fear and greed index moved to the extreme greed zone in December 2019 as the Fed slashed interest rates. It then rose after the pandemic as the Fed slashed rates and implemented its biggest quantitative easing policy ever.
The index is made up of other sub-indexes. For example, the stock price strength measures the number of stocks hitting a 52-week high and lows. On the other hand, the safe-haven demand looks at the overall demand for bonds, which are typically safer than stocks.
Fear and greed index chart
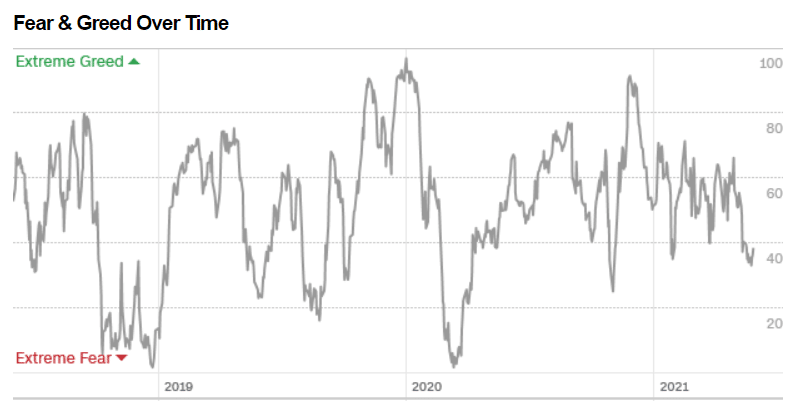
It also has a stock price breadth, considering the volume of top gainers and top losers in the stock market. Other parts of the fear and greed index are the put and call options, market volatility, market momentum, and junk bond demand. The chart below shows the fear and greed index between 2019 and 2021.
CBOE volatility index (VIX)
The CBOE Volatility Index is a popular tool that CBOE developed in collaboration with Goldman Sachs. It is the most widely-used gauge for measuring the amount of volatility in the stock market.
The VIX index does this by looking at the put and call options in the S&P 500 index. Specifically, it looks at the middle point of real-time S&P 500 option bids and the ask prices.
For starters, options are an important component in the market because they tell you how large investors are positioning themselves for the future. The information is also provided for free, making it easy to use.
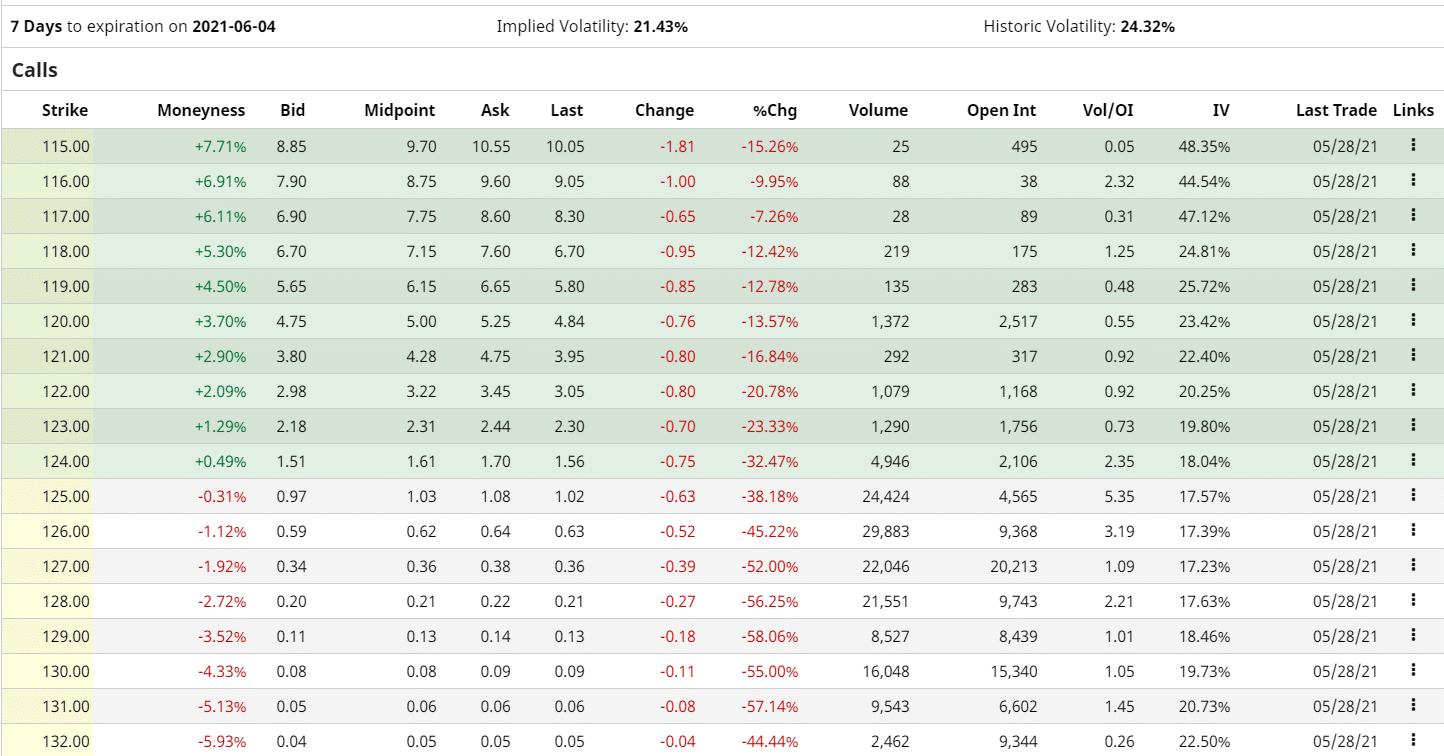
A put option gives a person or institution the right to sell an asset. But the person is not obligated to sell them. On the other hand, a call option gives people the right and not the obligation to buy an asset. For example, the chart below shows the calls of Apple shares.
Apple shares options
The chart below shows that the VIX index jumped to an all-time high of $82 in March during the coronavirus pandemic. At the time, most stock prices were retreating as investors feared about earnings.
VIX index chart
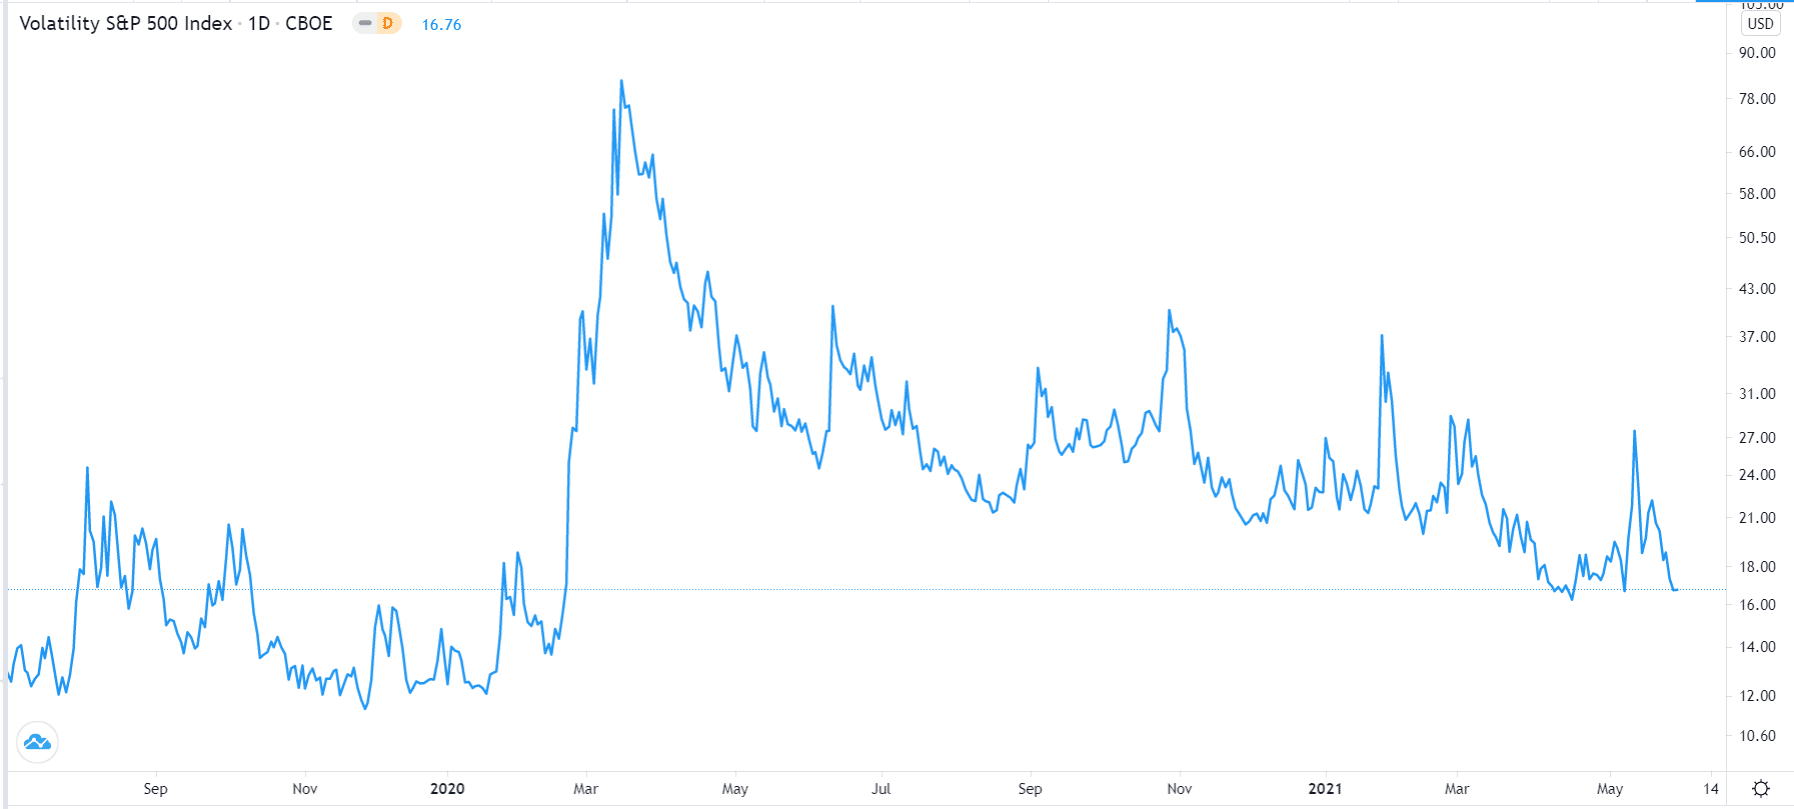
The CBOE VIX index then declined by 80% as stocks bounced back as the Fed lowered interest rates and the government implemented billions in the stimulus.
Buffett Indicator
Warren Buffett is one of the most respected investors in the world. Investors appreciate his success in the stock market for more than six decades. This has made Berkshire Hathaway one of the biggest companies in the world, with a market cap of more than $700 billion.
The Buffett indicator is a tool that Warren Buffett has recommended in the past. It is calculated by simply looking at the total market capitalization of all companies in the United States and comparing it with the GDP.
For example, the total market cap of all firms has jumped to more than $43.9 trillion, while the US has a GDP of more than $21 trillion. Therefore, the ratio of the total market cap to GDP has surged to more than 200%. Further, when the Fed’s assets are added to the GDP, the ratio falls to about 150%.
Buffett Indicator chart
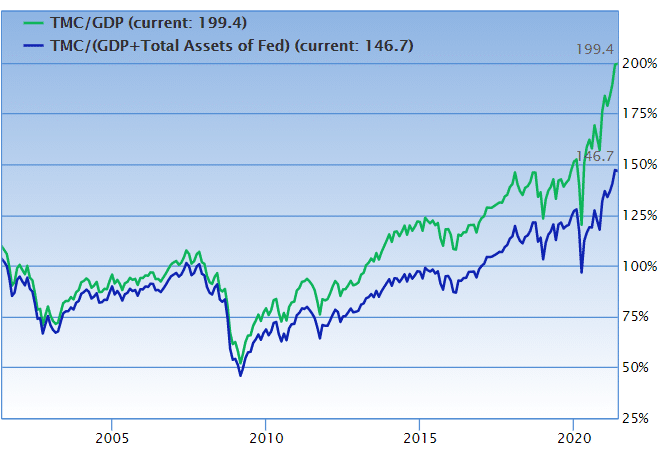
While the Buffett Indicator is a popular sentiment tool, it does not provide a good signal of when to buy or sell stocks. For one, a small handful of companies like Apple, Microsoft, Amazon, and Google have seen their market cap jump to more than $8 trillion. Also, many of the biggest American companies are now making most of their revenue from abroad.
S&P 500 P/E ratio
The S&P 500 is the most followed index in the United States. It is different from the Nasdaq 100 because of the fact that its constituent companies are more diverse. It also has more companies than the Dow Jones and the Nasdaq 100.
On the other hand, price-to-earnings is a popular metric that looks at the company’s share price and earnings. Therefore, the P/E ratio of the S&P 500 is used as a gauge of the market sentiment.
Ideally, when the PE ratio rises, it sends a signal that investors are more optimistic about future earnings. It also means that investors are willing to take more risks. Similarly, when it falls, it sends a signal that investors are afraid of being in the stock market and pessimistic about future earnings.
S&P 500 PE ratio
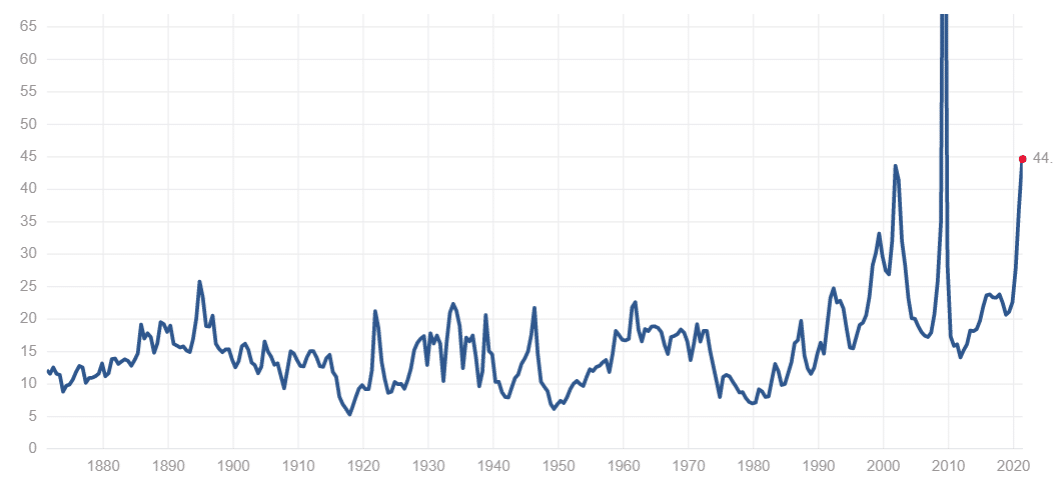
As shown above, the PE ratio rose sharply during the dot com bubble in the early 2000s and during the housing market bubble. These gains were followed by spectacular drops when the bubble burst.
Summary
Sentiment indicators can help you know when to buy or sell stocks and buy safe-haven assets like bonds. In this article, we have looked at four of these indicators. We have not looked at the McClellan Volume Summation Index and the stock price strength.