Introduction
Expansion in forex trading occurs when prices move in a particular direction-say on the upside or the downside after reversing from a certain trend. So, expansion can either be bullish or bearish depending on the price movement. Contraction occurs in a trading range when the dominant price direction has been aborted.
When contraction occurs in a bullish trend, prices will halt moving in the higher high direction, or making the lower lows in a bearish trend. The ranging movement in a contraction acts as the point of hesitation not just for the trader but for the market as well. The chart prepares to come out from a low-risk environment.
Note that in terms of fiscal policy explanation, expansion leads to lower valuation of currency while contraction brings out increasing value. When central banks intend to stimulate or grow economies, they result in aspects such as lowering interest rates and increasing the supply of money. As a currency trader, this action is a bearish sign. The vice-versa occurs in a contraction.
Identifying Indicators
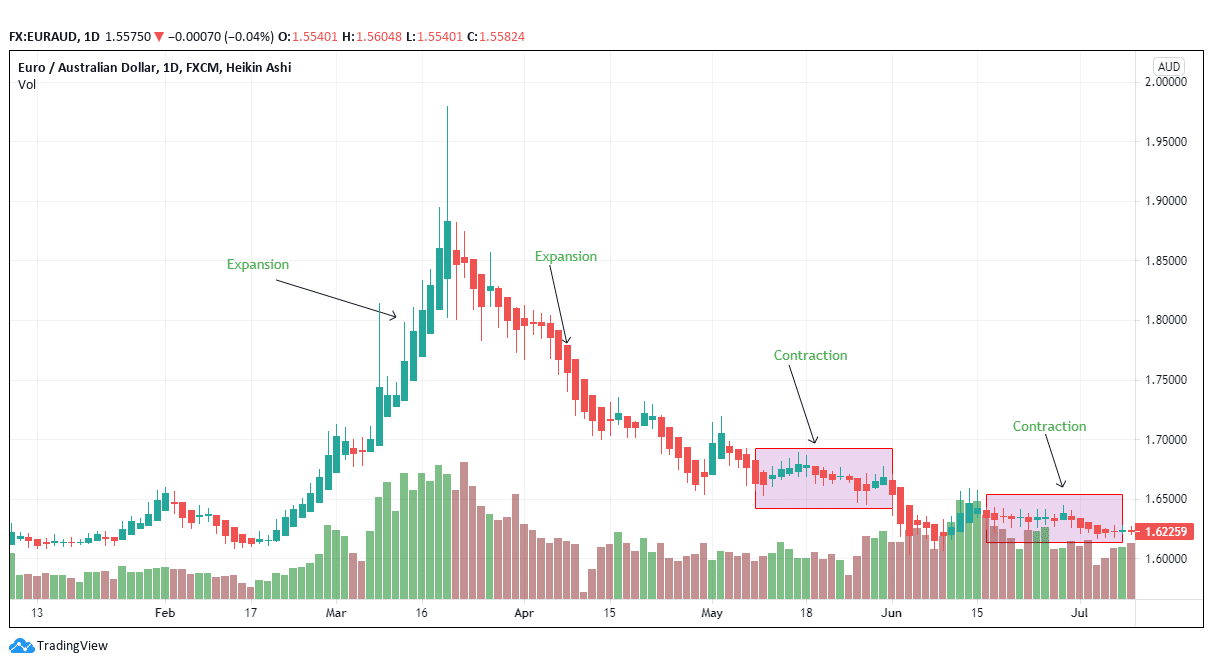
Figure 1: Expansion and Contraction in EUR/AUD
1. Explanation using Fibonacci Retracement indicators
The Fibonacci indicator is used to analyze the trend strategy of the trade. The traders will observe how the retracements occur after or before market expansion. This assessment helps the trader to know when to make low-risk entries.
An expansion in the market is considered to be a high-risk entry zone. Day-traders can make high losses if they enter a bullish expansion expecting a bearish turn or vice-versa.
Let us see how the Fibonacci levels in the EUR/AUD trading chart appear.
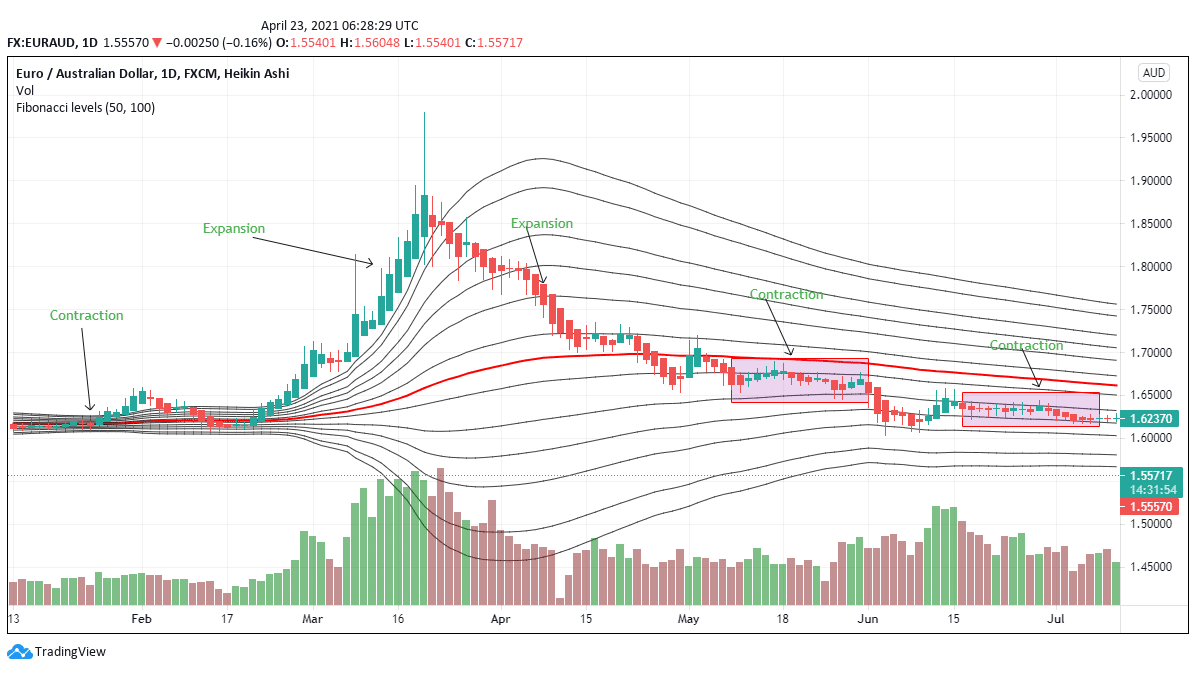
Figure 2: Fibonacci levels in the EUR/AUD currency pair
Figure 2 shows prices alternating between expansion and contraction in the short term. The bullish expansion from a contracted position in figure 2, may have been caused by an abrupt dip in prices with traders intending to buy the currency pair at a cheaper price.
As of January 29, 2020, the average price of the EUR/AUD pair was 1.6289. The bullish expansion on the selected part began on February 18, 2020, when the pair’s price had fallen slightly to 1.6150. There was a slight sell-off between these two periods as some traders- individual traders thought the pair was trending downwards as opposed to the pair becoming cheap.
As most turn to short-selling between these two periods, the major traders are buying off their positions. From February 18, 2020, the short positions are redistributed across the board (at discounted prices) driving prices steadily as the market is hit by a short-term panic. Their pair picks an expansion into the bullish zone. The individual traders then intensify their buying spree when the pair has now increased in price.
As of March 9, 2020 prices had hit 1.7267 (an increase of 6.92%) from the low of 1.6150 on February 18, 2020. Major traders then plan their exit strategy and as is shown in figure 2, they exit the trade on March 19, 2020, when the prices have hit a high of 1.8867. Influential traders that sold off their short positions at 1.6150 on February 18, 2020, made a profit of 16.82% after exiting the market on March 19, 2020.
The traders applied the reverse strategy during the bearish expansion from March 19, 2020, through to April 30, 2020, before the contraction kicked in. The long-positions are sold at the top which now becomes a false upside breakout. They sell the long-positions at low prices, driving down prices.
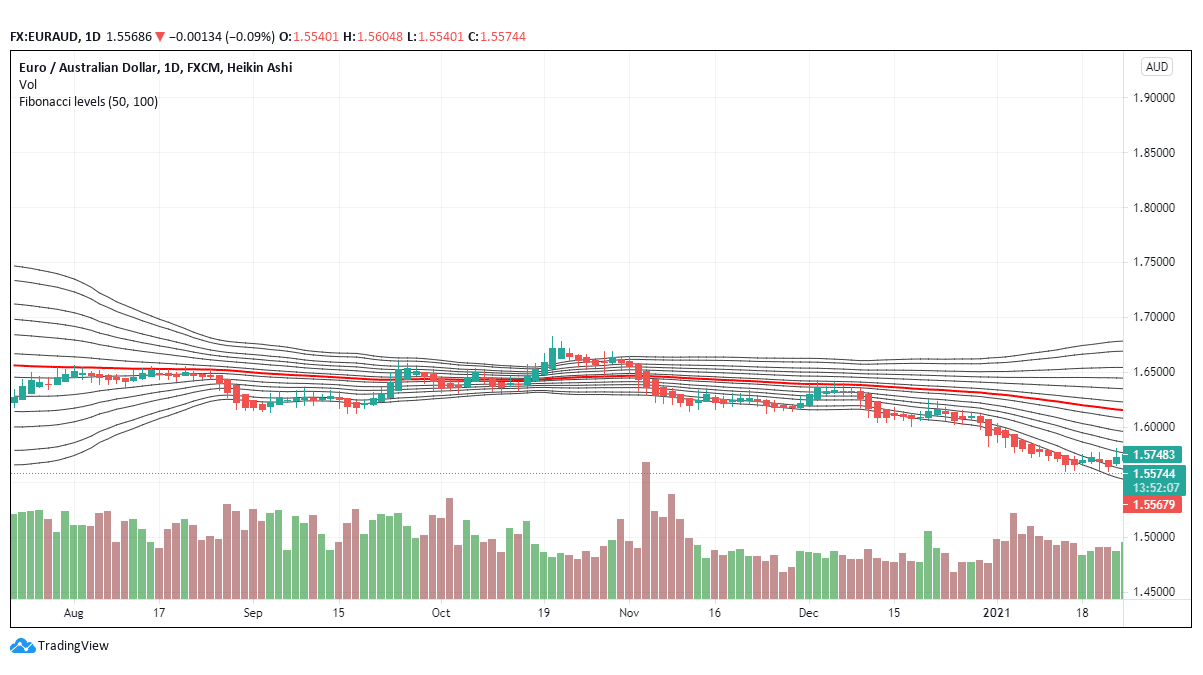
Figure 3: Long-term EUR/AUD pair contraction
The selling continues until the price reaches the maximum point coinciding with the prior price movement. From a swing trader’s perspective, prices continue contracting for months, until a bearish expansion begins to form in January 2021.
2. Bollinger Bands
The trader can also use the Bollinger bands to analyze periods of expansion and contraction. The Bollinger bands help to reveal the times when the currency pair or stock halted to move in higher highs (in bullish expansion) or lower lows (in bearish expansion). The stoppage period becomes the contraction zone.
Bollinger indicators are two bands in the price chart in the upside and downside. Apart from analyzing contraction and expansion, they also indicate the volatility of the price.
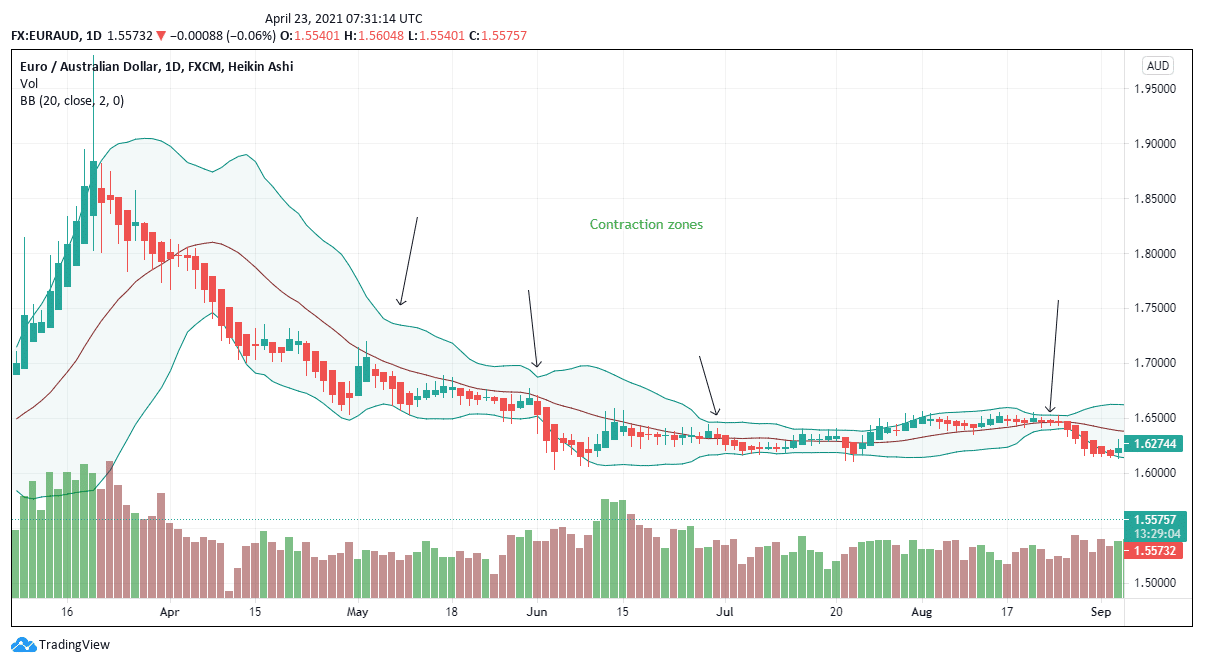
Figure 4: Bollinger Bands in the EUR/AUD pair
When the two bands close in together, they indicate a forex/ stock contraction. After the contraction, the trader can expect some expansion, either on the downside or the upside depending on volatility and volume action.
Watch for the outer band when predicting price movement. When the price implodes within the contracted zone, the trader should prepare to maintain the selling position.
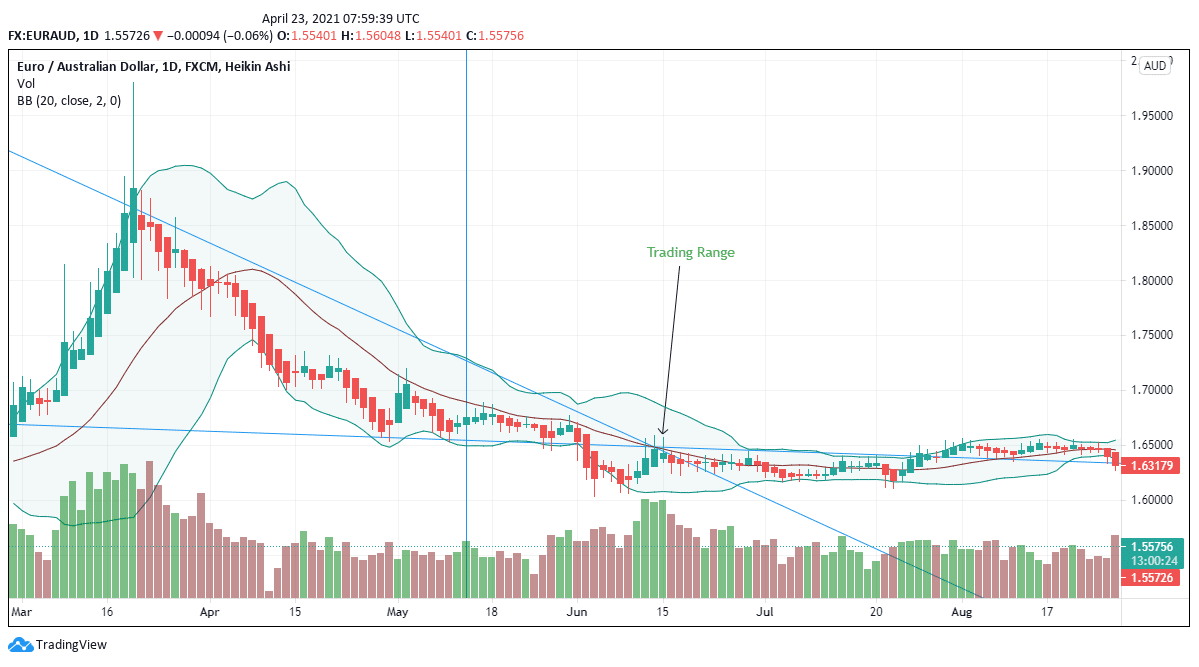
Figure 5: Explosion and implosion of Bollinger bands
A look at the implosion and explosion points using an extended line will reveal to the trader the range of trading. As of June 12, 2020, the EUR/AUD traded at an average price of 1.6483 and a high of 1.6585. The pair maintained this position as the resistance point until October 20, 2020, when it crossed to 1.6781.
This knowledge is vital as it shows who between buyers and sellers has control of the market trend. If the price after contracting maintains a bearish expansion, then the trader should understand that the market is controlled by the sellers. If the price is exploding above the outer band of the Bollinger indicator, then the buyers have control of the market.
Both the Fibonacci retracement and the Bollinger bands are vital points to measure the price trend and understand volatility. However, they should not be used in isolation. Other indicators such as volume, RSI, and oscillators are necessary to help support the trader’s position before entry or exit.
Conclusion
Expansion and contraction have been explained as important tenets in comprehending price action. The two indicators that have been investigated in this article include the Bollinger bands and the Fibonacci retracement levels. These indicators are vital in determining the technical trend of the price, but they should be used with other measures of volatility to establish action.