Divergence comes from the term ‘diverge,’ which means moving in the opposite direction from a common point. Similarly, in forex and the financial market in general, it refers to a situation when the price of a security is moving in a different direction with an indicator.
In most periods, the indicators that are commonly used are oscillators like the Relative Strength Index (RSI) and the moving average convergence and divergence (MACD). In this article, we’ll look at some of the best strategies for using divergences when trading.
What is divergence in forex?
Forex traders use technical indicators to predict the future performance of a currency pair. Most indicators use historical data and mathematical calculations to estimate the direction of the asset. In most cases, the indicator will often move in the same direction as the financial asset.
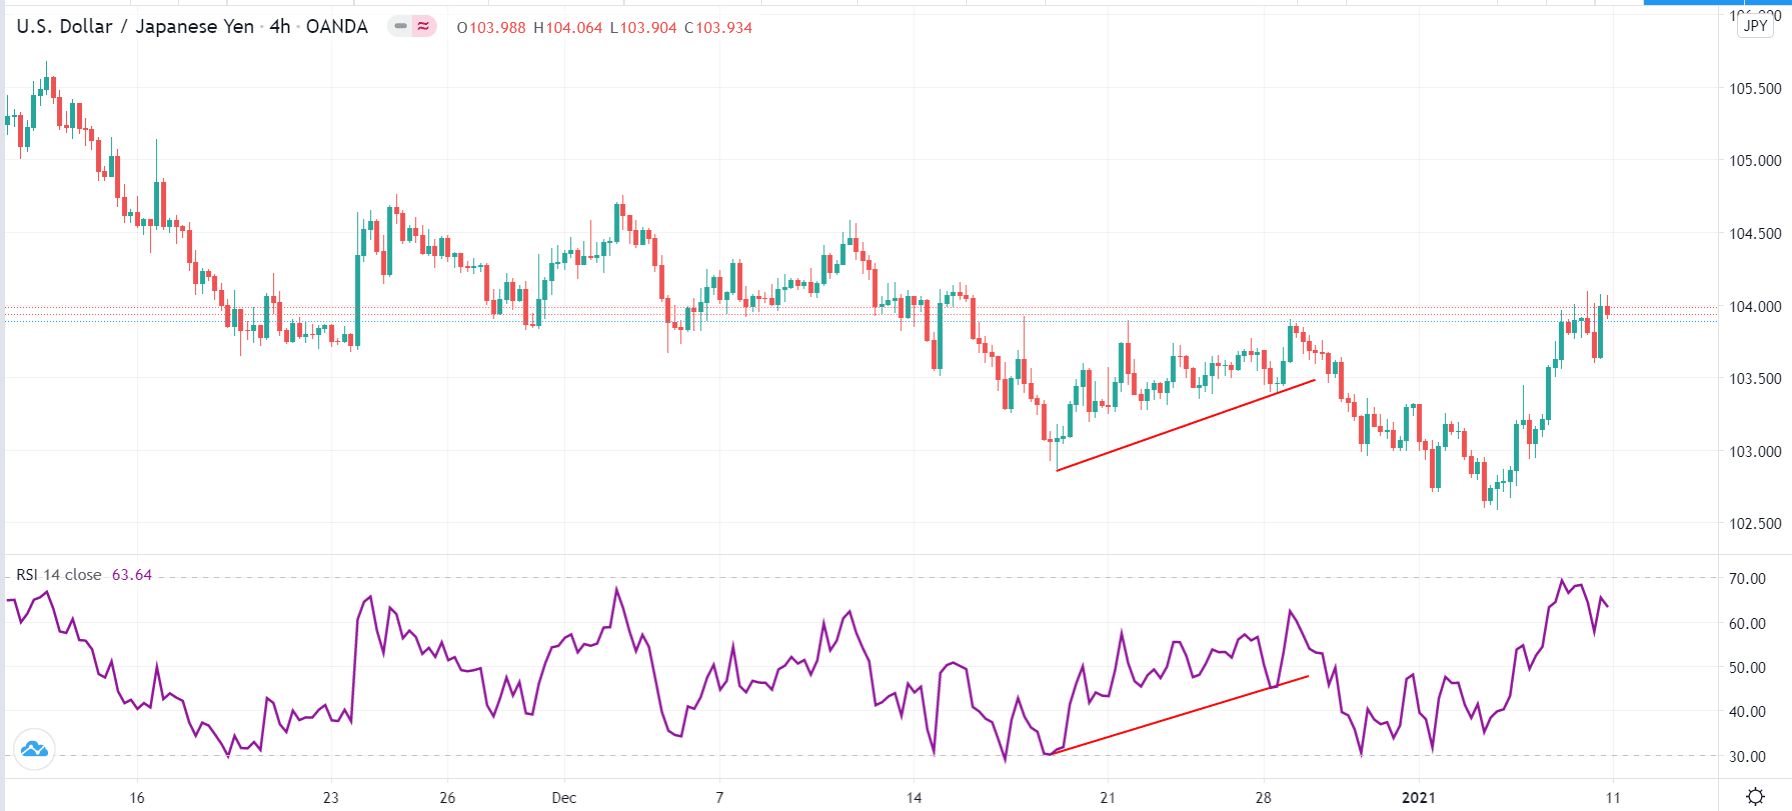
For example, when the RSI is rising, you will often see the currency pair rising as well. In the chart below, we see that the RSI and the USD/JPY pair are rising.

However, at times, the price of an asset will move in the opposite direction with the indicator. This is known as divergence and is often a sign that a reversal is about to happen.
Divergence also applies in other areas of the financial market. For instance, at times, the price of a stock will continue rising even after the weak performance of the company.
Using the relative strength index to trade divergence
The RSI is one of the most popular oscillators used to trade divergences. The indicator was developed by Welles Wilder, who is also known for coming up with the average directional index (ADX) and the average true range (ATR).
The RSI is a relatively difficult indicator to calculate since it involves finding the average gain and average loss. Then, you calculate the relative strength using this data. As a day trader, you should not bother doing all these calculations. Instead, you should focus on adding the indicator and interpreting it.
The RSI indicator usually oscillates between 0 and 100. When the price moves above 70, it is often said to be overbought, and when it moves below 30, it is said to be oversold.
Another way of using the RSI is to find the divergence. To do this, you should join the highest points of the indicator and find whether it is moving in the same direction as the price.
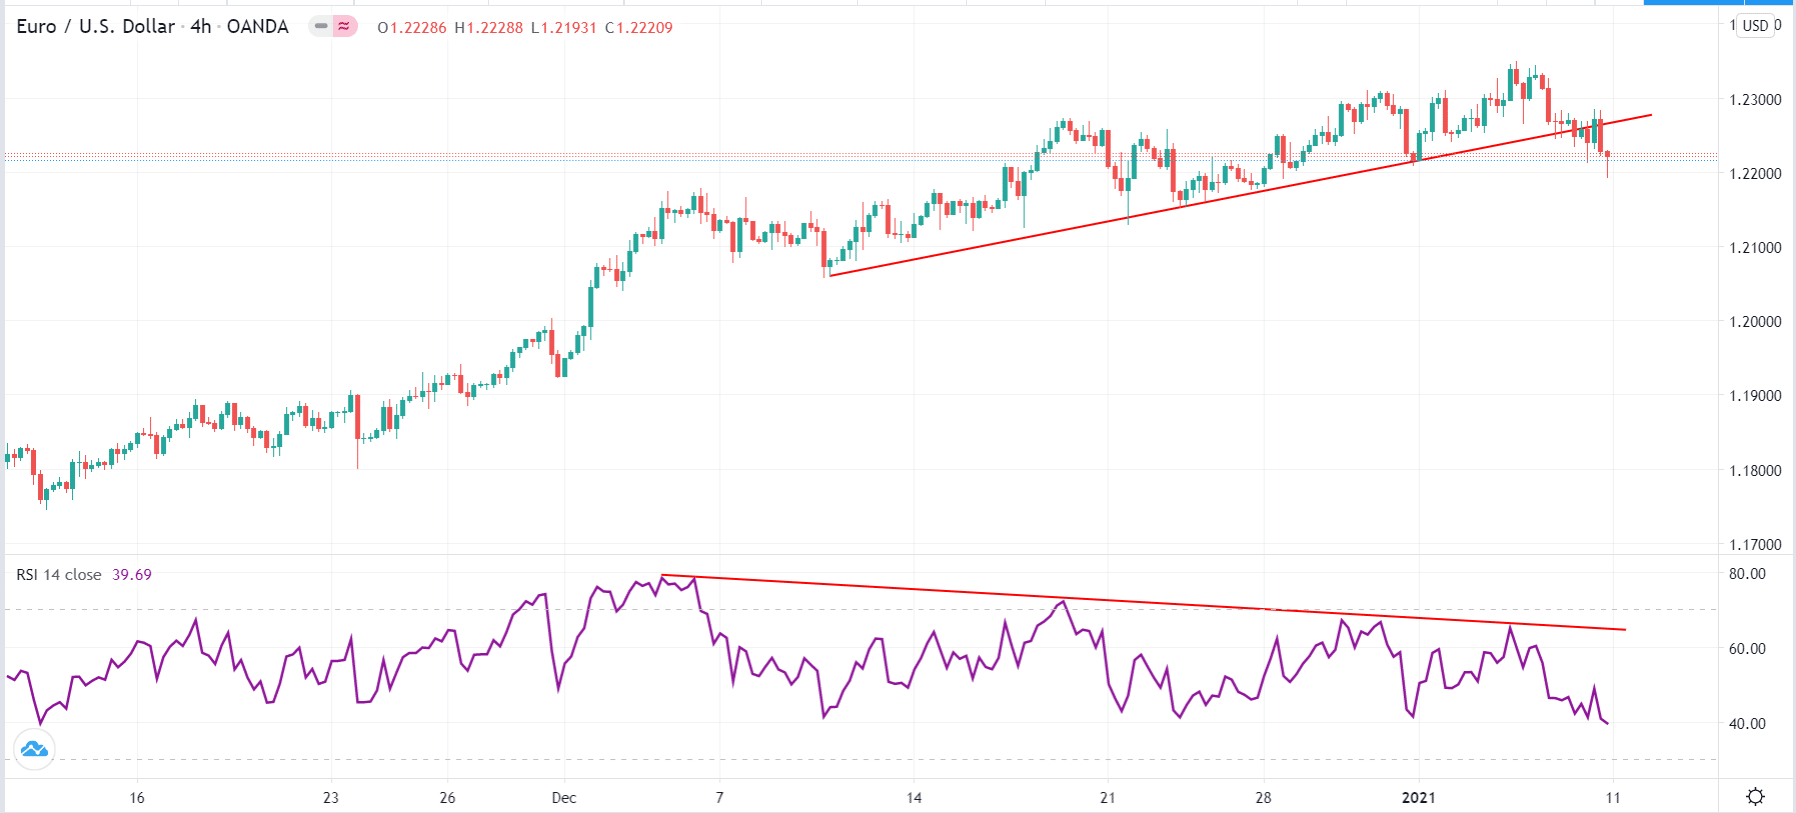
For example, in the chart below, we see that the EUR/USD has been in an upward trend. We have joined the lower highs with a red trendline. At the same time, we see that the RSI is moving in an overall downward trend.
Therefore, the implication here is that the upward strength is losing momentum. Subsequently, this sends a warning to the bulls about an impending pullback. To play it safe, you should short the pair when the price has moved below the rising trendline.
EUR/USD divergence

Using MACD to trade divergence
The MACD is an important indicator that converts two moving averages into an oscillator. It does this by subtracting the longer MA from the shorter one. The indicator was developed by Gerald Appel more than 40 years ago.
Unlike the RSI, the MACD has a centerline, which is an important level watched by traders. Also, it can be used to identify overbought and oversold levels. Traders also watch the places where the two averages cross for a sign of entry.
The MACD is relatively easier to calculate. To draw the MACD line, you subtract the 12-day exponential moving average from the 26-day EMA. Then, the signal line will be the 9-day EMS, while the histogram is the MACD line minus the signal line.
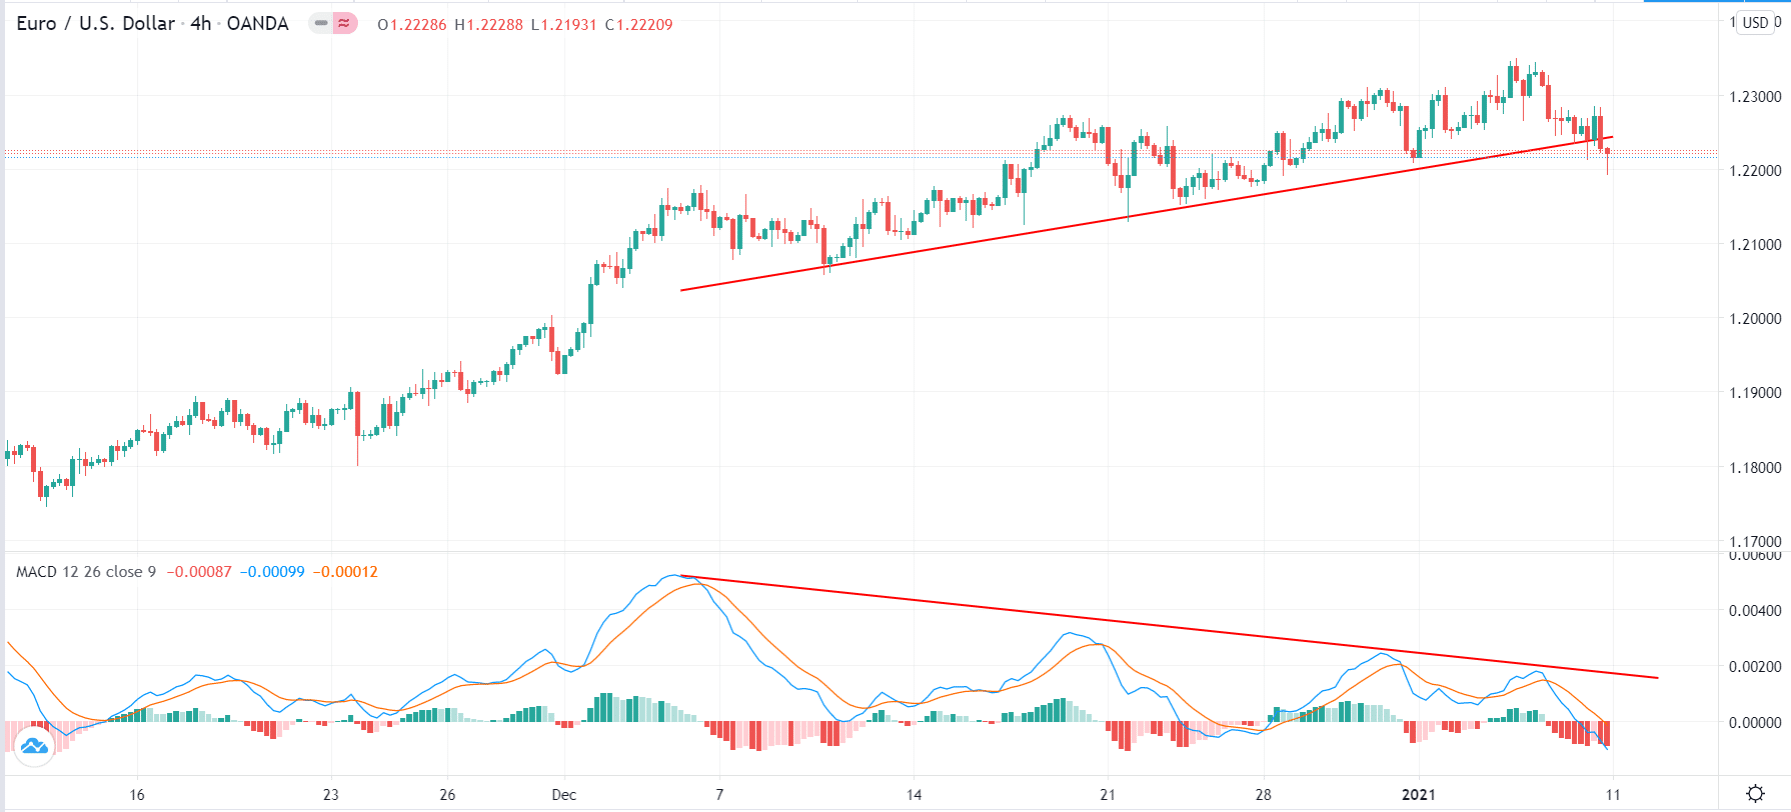
Like the RSI, the MACD and signal lines move up when the price is rising and vice versa. Therefore, you can find a divergence by joining the extreme sides of the MACD and that of the price to see whether they are moving in the same direction. A good example of this is shown in the same EUR/USD pair used above.
As you can see, while the EUR/USD is rising, the extreme sides of the MACD are dropping. This is further evidence that the pair will reverse.
Using MACD to find divergence

Using the Awesome Oscillator to find divergences
Another indicator used to find divergences is the Awesome Oscillator. It was developed by Bill Williams, who has also developed other indicators like the Alligator, Accelerator Oscillator, fractals, and the Market Facilitation Index (MFI).
The Awesome Oscillator is calculated by finding the difference between a long simple moving average and the shorter one. The most popular periods used are the 34-period and 5-period SMAs. It has a zero-line, which is used as a confirmation of a bullish and bearish trend.
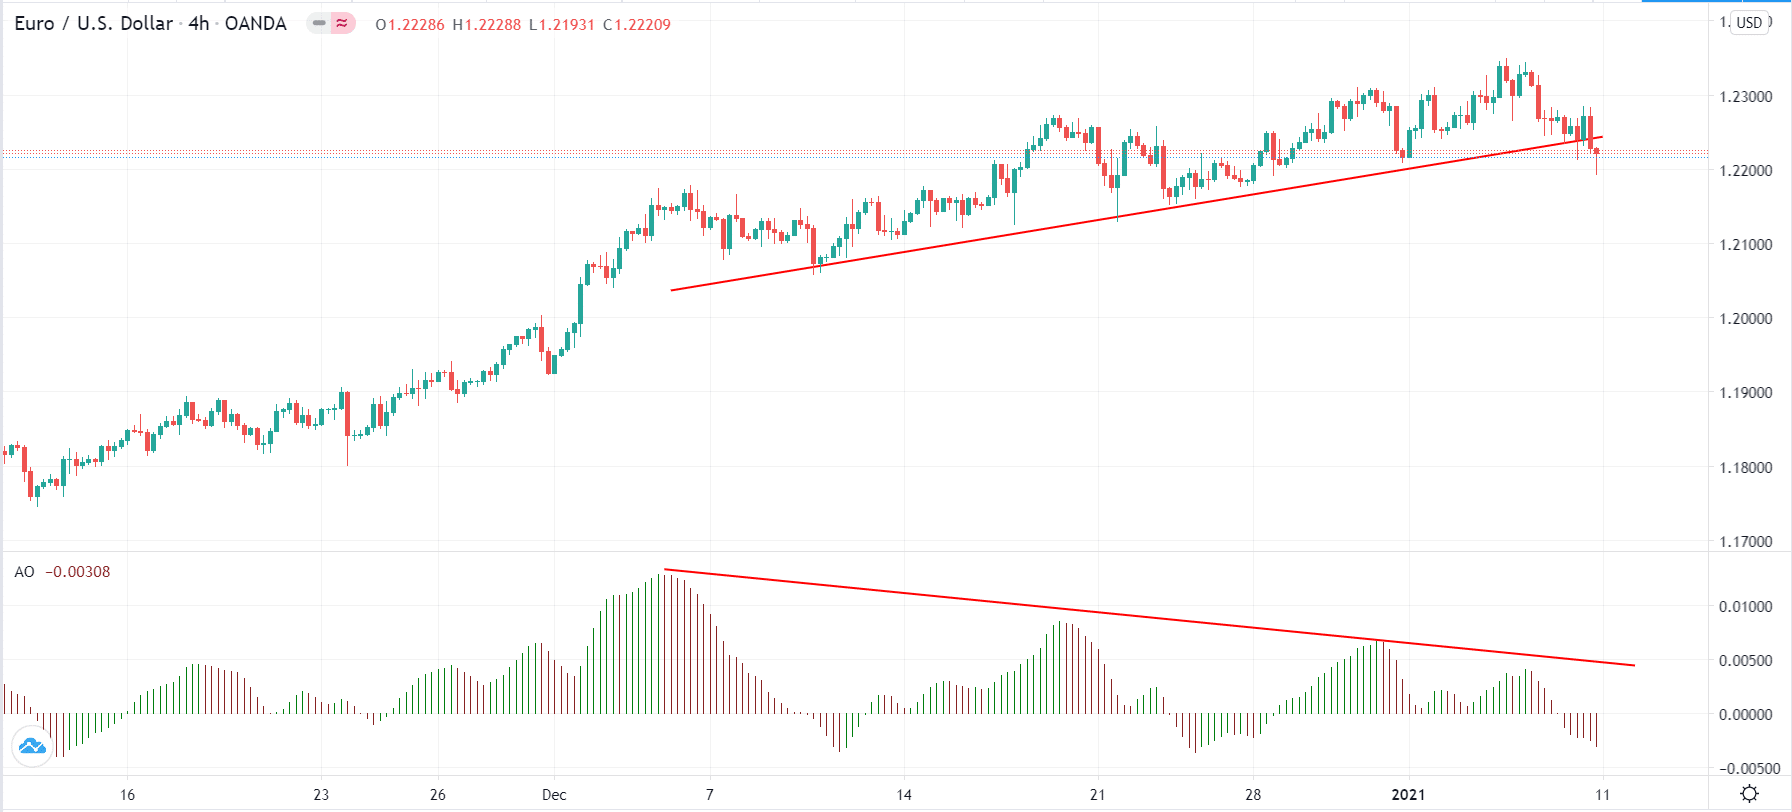
Traders use the AO to buy when the indicator is sharply below the neutral level and to short when it is at the highest. Also, joining the various peaks of the indicator can reveal whether there is a divergence. An example of this is in the same four-hour chart of the EUR/USD pair.
Awesome Oscillator example

You can use other indicators to find this divergence. Some that you can use include the stochastic oscillator, Average Directional Index (ADX), and the Relative Vigour Index (RVI).
Final thoughts
Divergence is an important concept in trading because it is an early indicator of what will come. However, as you have seen above, it is not often ideal for day traders and scalpers because the formation can take many days and months to form.
To trade it well, we recommend that you use a combination of oscillators to confirm its formation. Also, you should use tools like trendlines, Fibonacci retracement, and the Andrews pitchfork to identify key levels.
Most importantly, you should use pending orders to trade the strategy. In the example above, you could use a sell stop at 1.2200 to take advantage of the divergence.