Volume is a major component of the forex market because of crowd psychology. In most cases, traders like being part of the majority. They will buy when most people are buying and short when most people are short. Indeed, one way of realizing a false breakout is to identify whether such a move is backed by volume. Let us look at the best volume indicators to use in forex trading.
Accumulation and distribution (A/D)
The accumulation and distribution indicator is based on the popular Dow theory, which explains how trends and reversals form. A trend usually starts slowly with a few participants. As it rises, other traders identify it and start buying or accumulating it. After reaching its peak, the smart money traders start to exit their trades, leading to what is known as distribution.
The Accumulation and distribution indicator was created by Marc Chaikin, who is also known as the Chaikin oscillator. When used in a chart, the indicator attempts to explain the flow of money in and out of the financial asset.
The indicator is calculated using three steps. First, you identify the money flow multiplier using the following formula:
Multiplier = [(Period close – Period Low) – (Period high – close)] / (High – low)
Besides, you identify the volume of the money flow by multiplying the multiplier by the volume of the period.
Finally, the accumulation and distribution line is the addition of the previous AD and the current period’s money flow volume. As a result, the indicator will always fluctuate between +1 and -1. The chart below shows the accumulation/distribution line applied on the four-hour chart of the USD/TRY pair.
Accumulation/distribution example
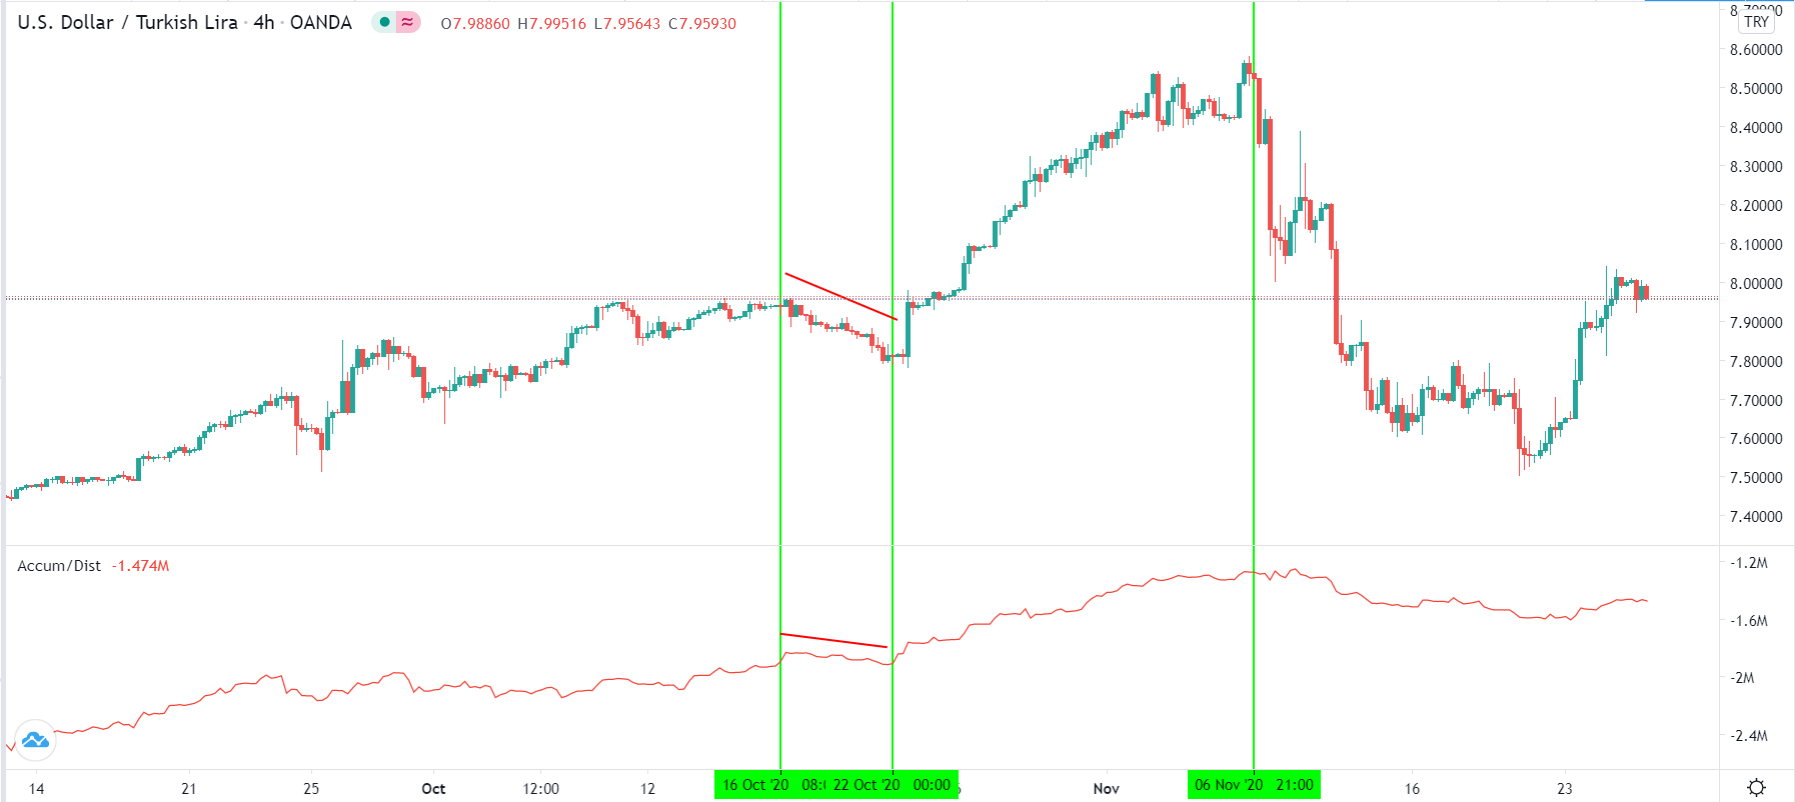
Unlike other technical indicators, the accumulation and distribution don’t tell you where to buy or sell. However, it can be used with other trends and oscillator indicators to confirm a signal.
Money Flow Index (MFI)
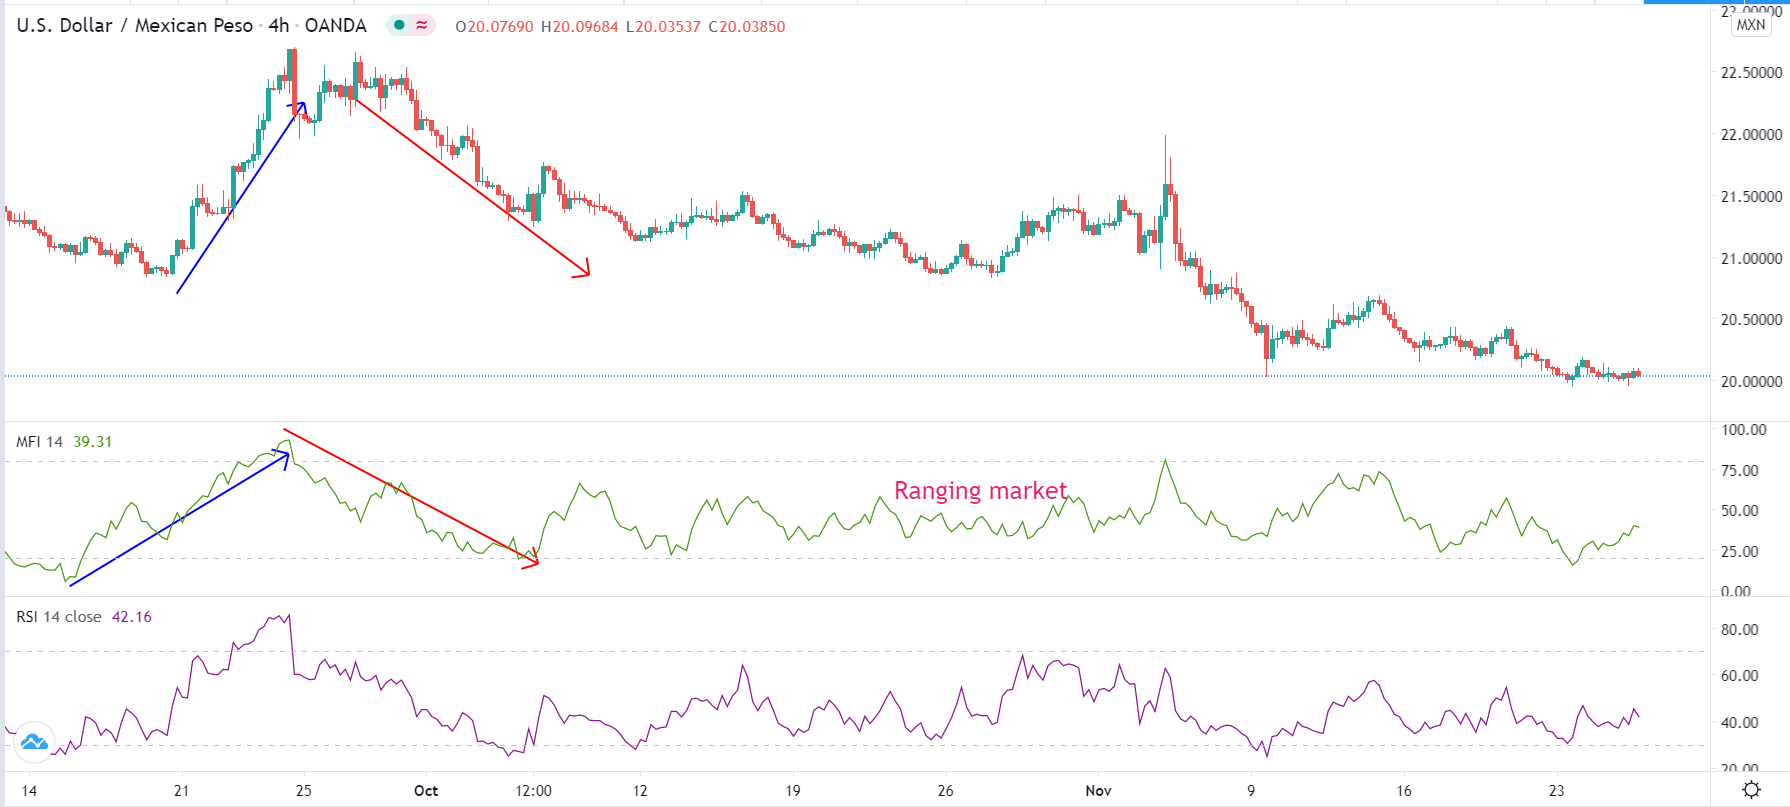
The Money Flow Index, popularly known as the MFI, is a popular volume indicator that resembles the Relative Strength Index (RSI). In fact, as shown below, when used in a chart, it’s hard to distinguish between the two.
The indicator, which was developed by Gene Quong, is mostly used to identify overbought and oversold positions in forex. You can also use it to identify divergences and to confirm trends.
There are four main steps of calculating the indicator:
- Calculate the typical price by adding the highest, lowest, and closing prices of the pair and then dividing the number by 3.
- Calculate the real money flow by multiplying the typical price with the volume.
- Find the money flow ratio by dividing the period’s positive money flow by the period’s negative money flow. The most commonly used period is 14.
- Find the MFI using this formula: 100 – 100/ (1 + money flow ratio).
In MFI and other forex indicators, you don’t need to understand the calculation process. In fact, as a trader, you will never be asked to do the calculations. Instead, you should focus on how to use and interpret it.
There are two main ways of using MFI. First, analysts recommend buying a currency pair when the MFI is below 25. The lower it is, the better the buying zone. Similarly, you should buy when the MFI moves above 75, which is the overbought level.
Second, if you are a trend-follower, you should buy when the MFI has emerged below 25 and is pointing upwards, and vice versa.
Finally, like the accumulation and distribution, you should use the MFI to verify what other indicators have signalled. That’s because, as shown below, the signals sent by the MFI are usually not very clear.
Accumulation & distribution example
On Balance Volume (OBV)
On Balance, Volume is a relatively simple-to-use volume indicator developed by Joe Granville. It is also one of the easiest indicators to calculate. When used in a chart, it has a close resemblance with the accumulation and distribution indicator.
OBV is calculated by just looking at days when volume increased and when it has fallen. For example, if the closing price of a currency pair is above the previous day’s close, then the OBV will be the addition of the previous day’s OBV to the current volume.
On the other hand, if the closing price is lower than the previous close, you subtract the current volume from the previous OBV. Finally, if the closing price is equal to the previous closing price, it simply means that there is no change.
OBV’s explanation is relatively simple. The indicator will keep rising when the number of volume-up days is higher than that of volume-down days. As such, when the OBV rises, it is usually a sign that the amount of volume is rising. A good example of this is shown in the chart below.
On-balance volume example
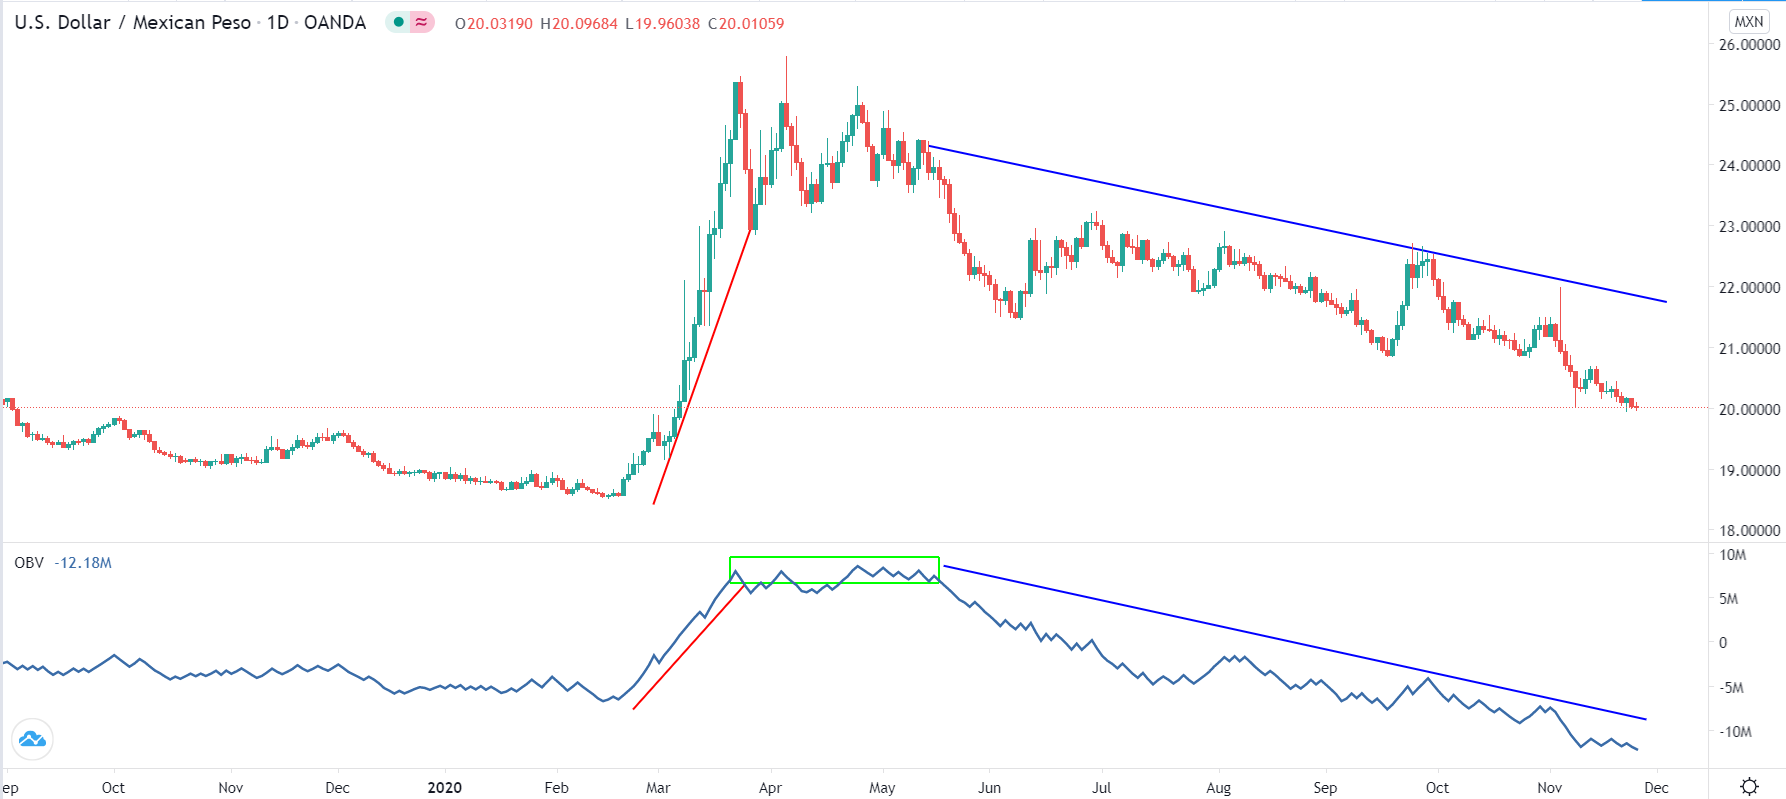
As shown, the OBV is ideal for traders with a long horizon. It can’t work well for scalpers and day traders. Also, like the other volume indicators, OBV is better used to complement other trend and oscillating indicators.
Chaikin Money Flow (CMF)
Like the accumulation and distribution indicator, the Chaikin Money Flow was suggested by Marc Chaikin. The indicator simply looks at a sum of the money flow volume for a certain period, which is often 21. As a result, it usually moves above and below the zero line. It generally looks at the buying and selling pressure in a currency pair.
Like all indicators with a single line and a neutral line, traders usually pay close attention to the zero line. When the line is below zero, it is usually a signal that the volume of sellers is more. As such, if the currency pair is falling and the line is below zero, it is a sign to hold on to the short trade. A buy signal emerges when the line is below the zero line and rising.
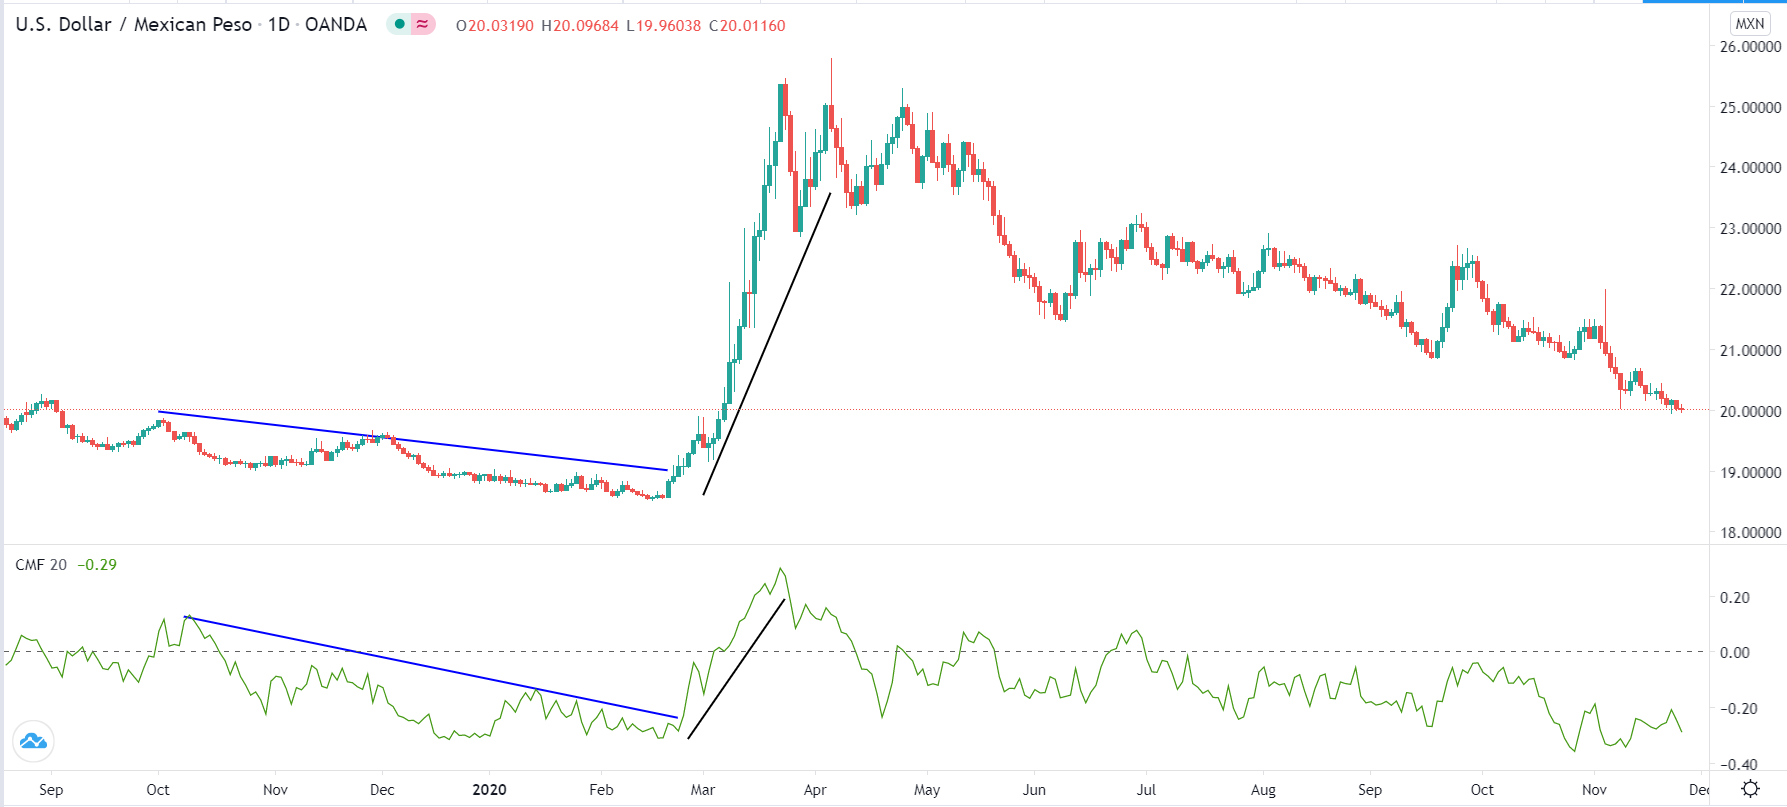
On the USD/MXN chart shown below, we see that the CMF indicator was below the zero line when the price was moving downwards. The line started rising when the price started falling also.
Chaikin money flow indicator example
Summary
Volume plays an important role in the financial market because it gives an overview of what traders are doing. The four indicators we have looked at here are important in explaining the role of the volume. However, most of them are better used in combination with other technical indicators like the moving average and Bollinger bands.