Price action is a day trading strategy that involves looking at charts and identifying certain patterns. It is a subsect of technical analysis, with the main difference being that it does not require the use of indicators like the Relative Strength Index (RSI) and the MACD. In this article, we will look at some of the most accurate price action patterns that work well in forex trading.
Pennants and flags
Pennants and flags are continuation patterns that occur when the price of an asset is trending upwards or downwards. The two patterns are usually formed in a similar way. The pennant looks like a triangle pattern, while the flag pattern looks like a rectangle.
The idea behind pennants and flags is relatively simple to understand. A bullish pennant or flag pattern happens when some traders start taking profit after an asset’s price moves up sharply. As they do this, the bullish trend starts to fade. When there are few sellers, the price forms a consolidation pattern. Ultimately, the price will break out higher and continue with the bullish trend.
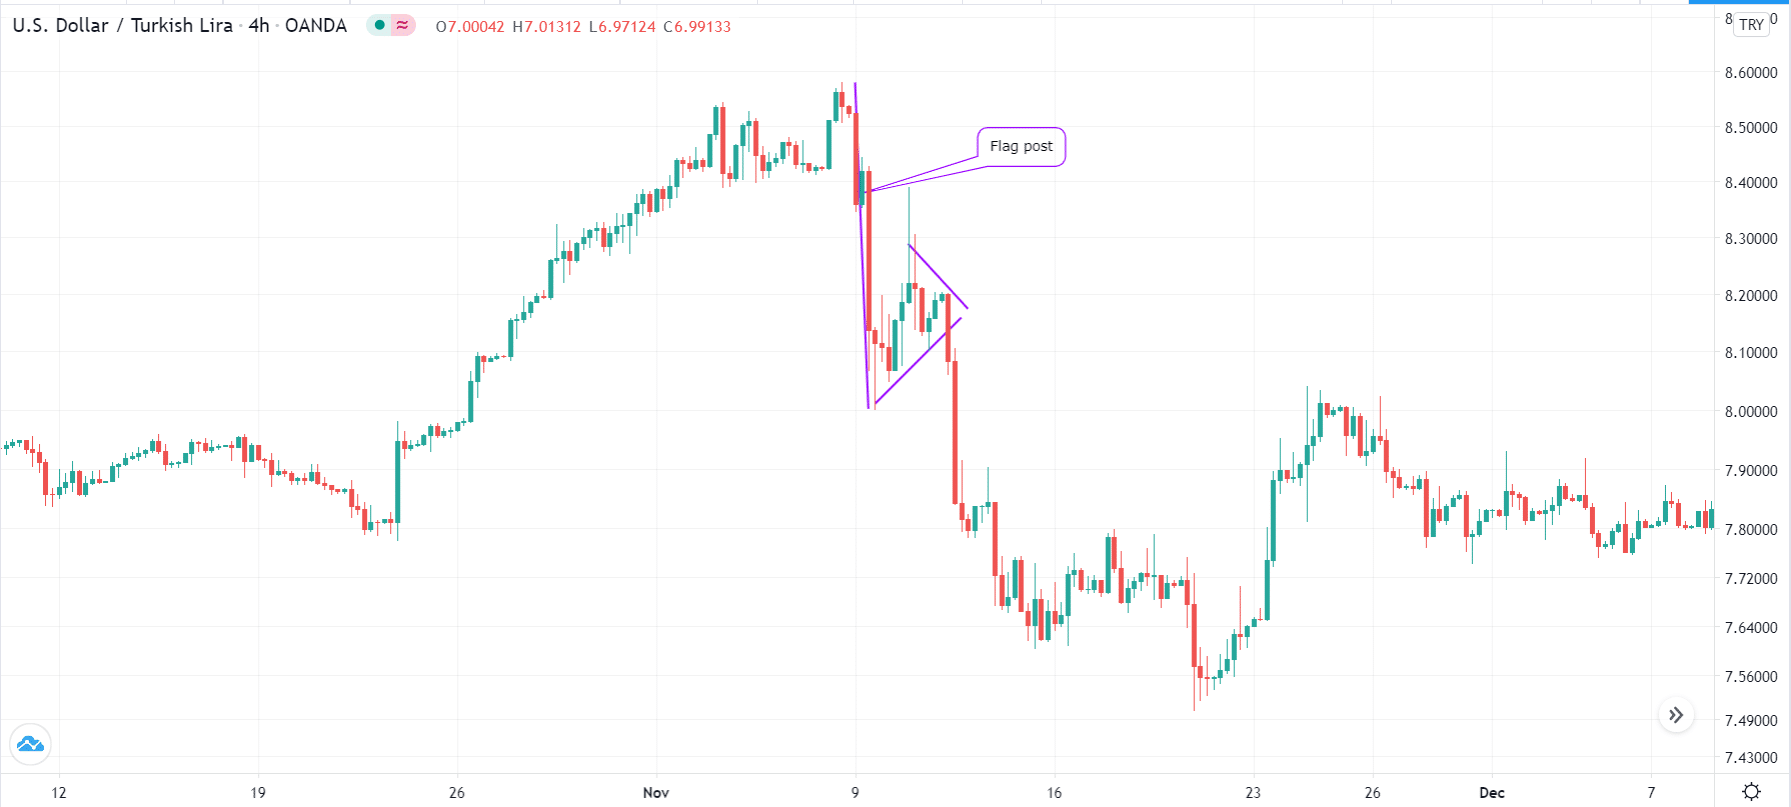
A bearish flag or pennant happens after the asset price falls sharply, forming a flag post. As some of the original sellers take profit, the price forms a consolidation pattern in the form of a triangle or a rectangle. Ultimately, the price will tend to break-out lower since the original for the downtrend is intact.
Bullish flags and pennants are some of the easiest to identify in forex charts. Also, they are among the most accurate ones to use.
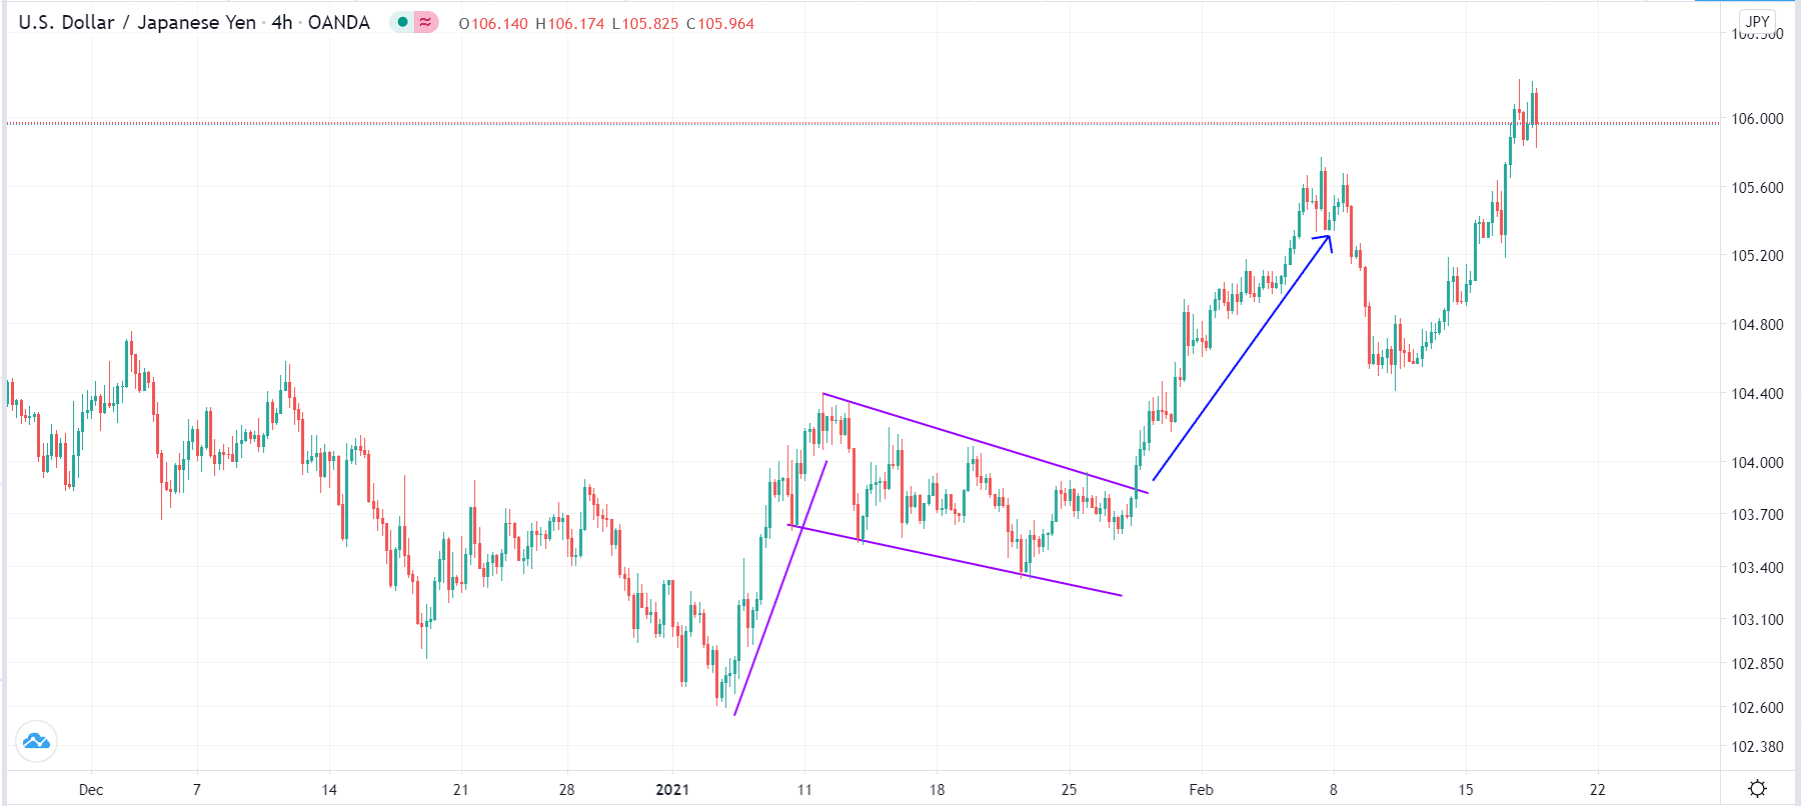
A good example of a bullish flag at work is in the USD/JPY chart below. You can see that the pair rose sharply in early 2021. After a few weeks, the price started to form a descending rectangle pattern, which is the flag. Ultimately, the price rose above the upper side of the flag pattern.
Bullish flag example
The bullish or bearish pennant pattern has a formation similar to a flag, as shown in the chart below. As seen, the USD/TRY pair moved sharply lower and then formed a small triangle pattern before breaking-out lower.
USD/TRY bearish flag
Triangle patterns
Triangles are important price action patterns that work. A triangle forms when there is indecision among buyers and sellers in the market. In most cases, triangles form between an existing trend. There are three main types of triangle patterns in forex:
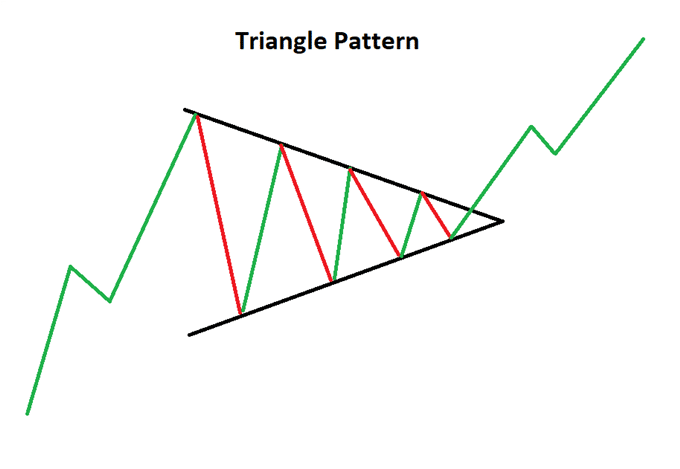
- Symmetrical triangle – This is a triangle formed when there are two converging lines in a chart. To draw these lines, you need to connect the lowest and highest swings as shown in the chart below. This triangle is usually neutral, meaning that the price could break-out in either direction.
- Ascending triangle – This triangle forms when an ascending currency pair hits a major resistance. After this, the price declines and starts forming higher lows and fails to move above the resistance level. In most cases, an ascending triangle is usually a bullish sign.
- Descending triangle – This is the opposite of an ascending triangle. It forms when a falling currency pair hits major support. Because of indecision, the price starts forming lower lows, resulting in a falling trendline. In most cases, descending triangles lead to lower breakouts.
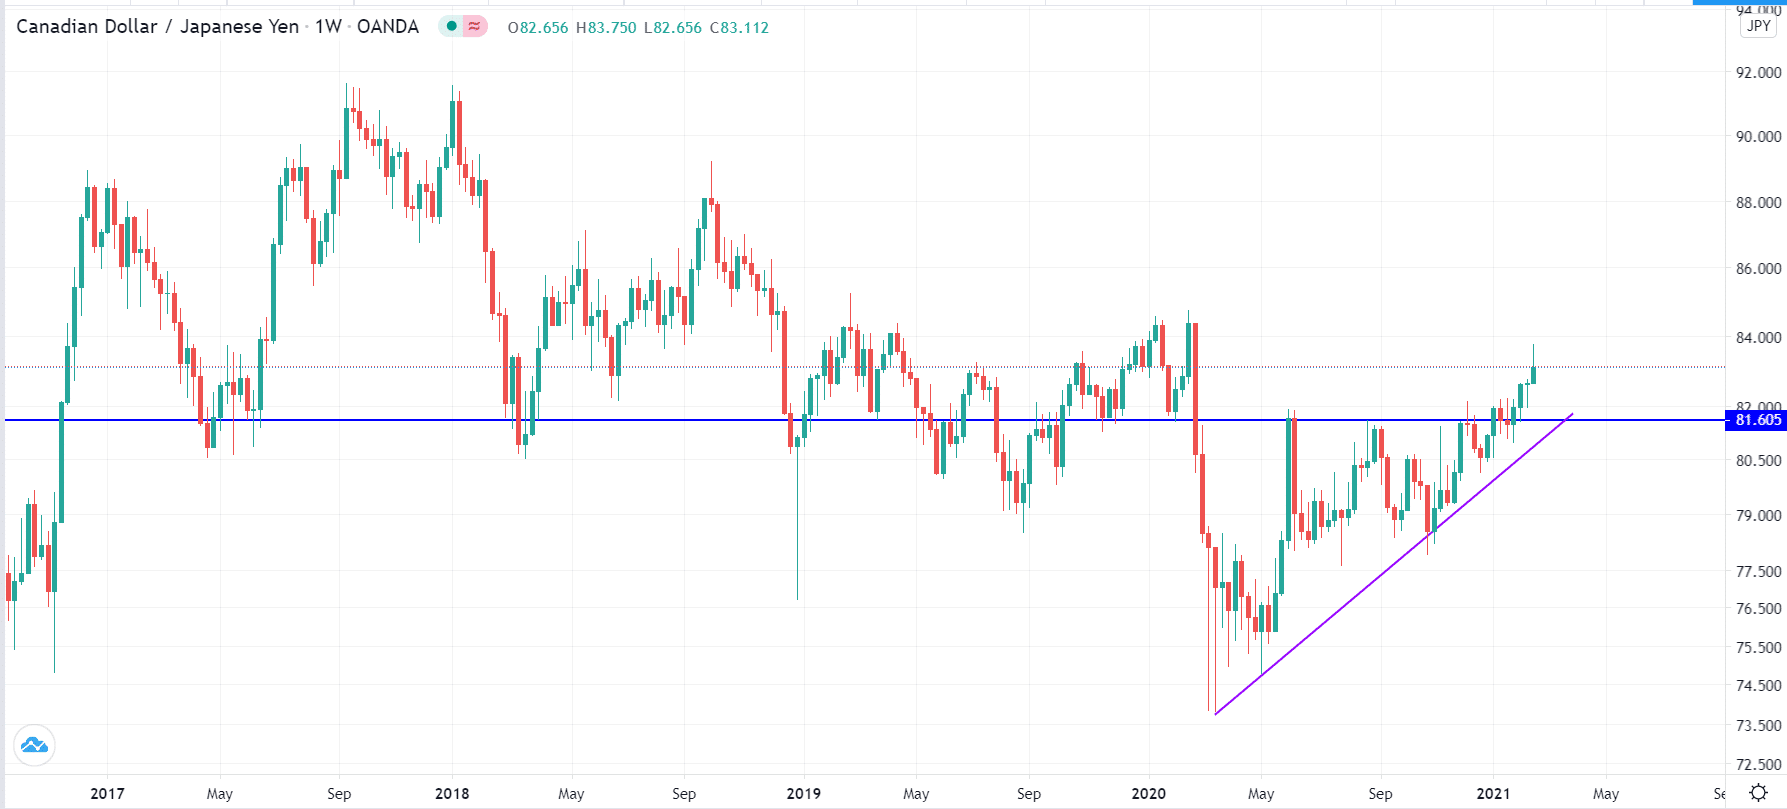
A good example of an ascending triangle pattern is in the CAD/JPY pair below. As you can see, after a sharp decline, the price started rising and found resistance at the 81.60 level. After that, the price started falling and forming an ascending trendline. Ultimately, the price made a bullish breakout.
Ascending triangle example
Head and shoulders pattern
The head and shoulders is a reversal pattern that happens during an uptrend. The pattern is made up of four main sections. First, there is the left shoulder that is the first to form. It forms when the price suddenly declines.
Second, there is the head, which follows the left shoulder. It forms when bulls return and push the price above the left shoulder. Third, there is the right shoulder that forms after the price drops from the head. Finally, there is a neckline that connects the three parts.
When the head and shoulders pattern forms, it is usually a sign that bulls cannot sustain the uptrend. As a result, in most cases, bears will push the price lower below the neckline.
The chart below is an example of a head and shoulders pattern that is forming on the GBP/USD. The pair was previously in an uptrend but found resistance at 1.3865. It then declined and then rose to 1.3935 and is now in the process of forming the right shoulder. Ultimately, the pair will likely bounce back to complete the right shoulder. It will then move below this neckline.
Head and shoulders example
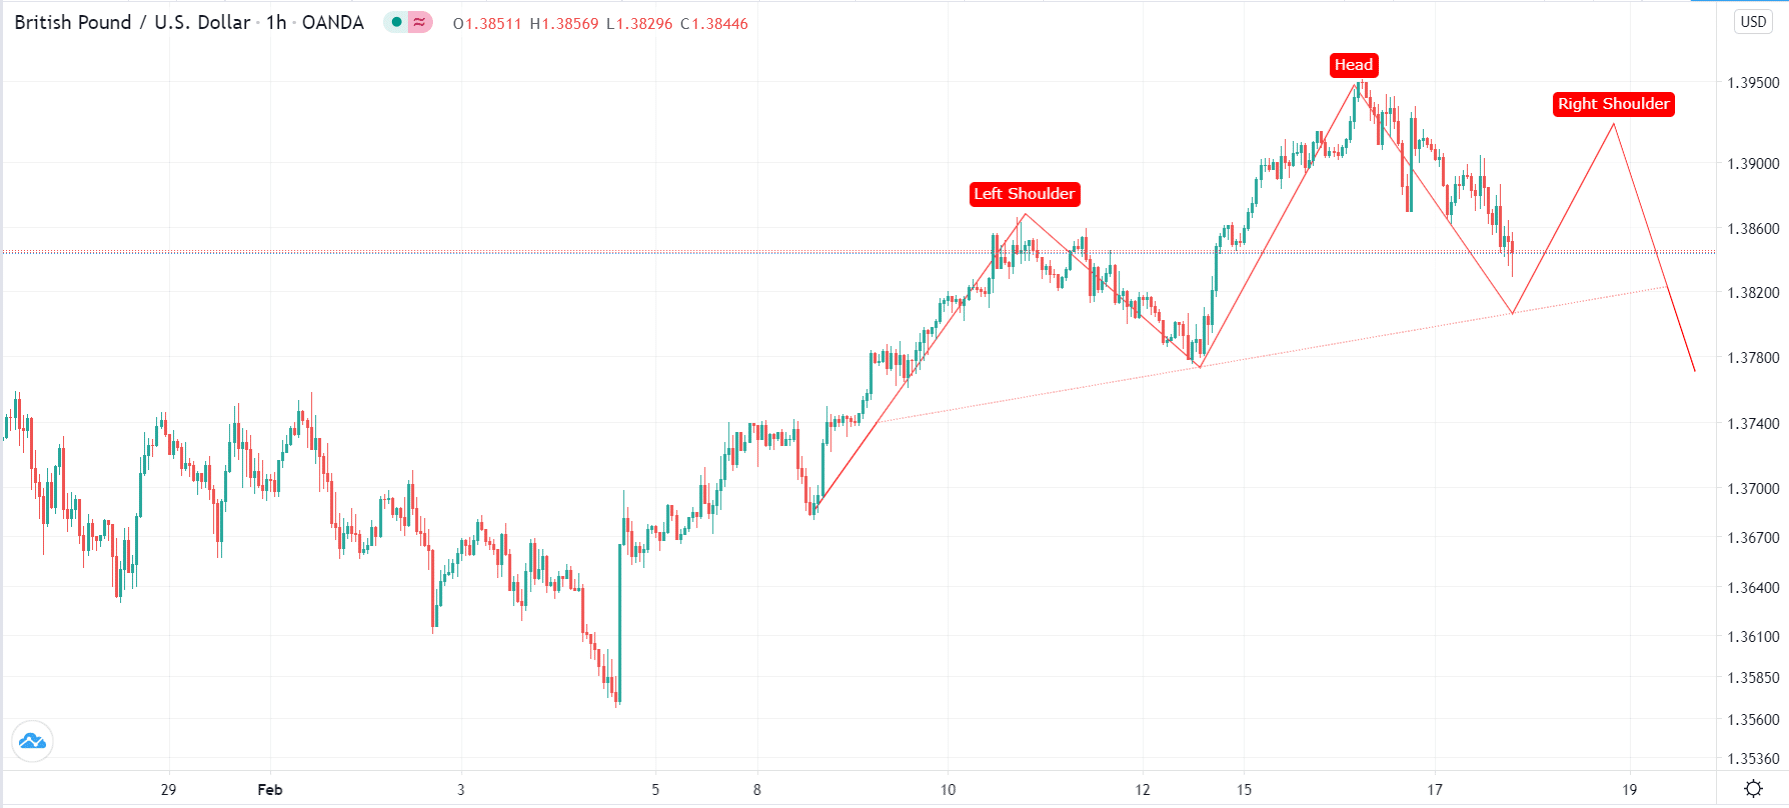
After moving below the neckline, the price usually drops the same distance from the head and the neckline.
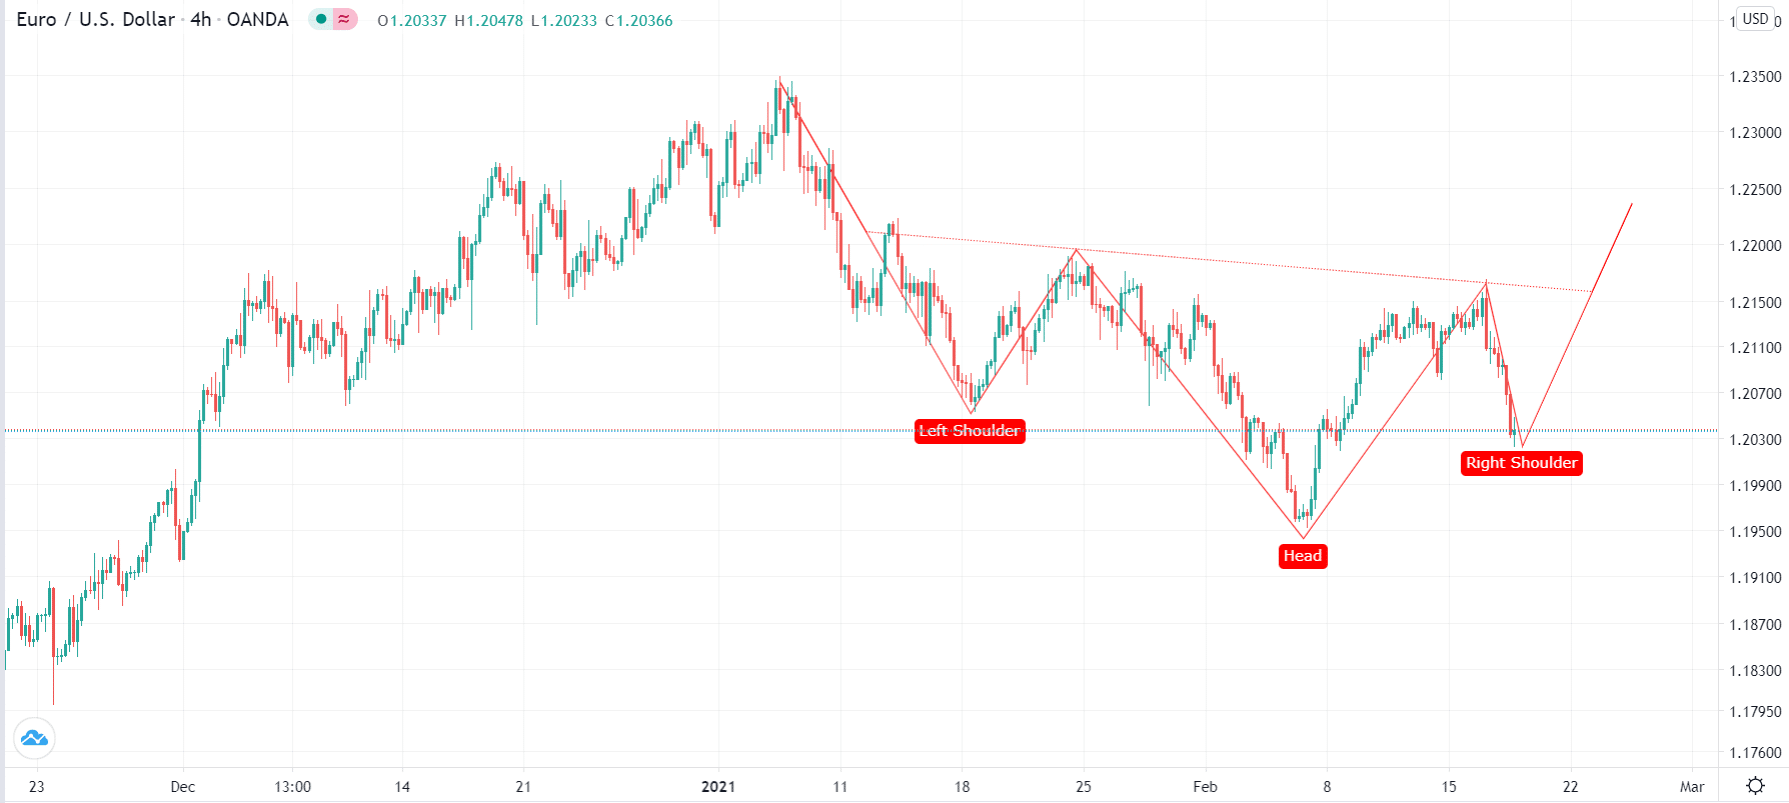
The inverted head and shoulders pattern is the bullish opposite of the H&S. It forms during a downtrend and tends to break out higher. An example of this is shown in the chart below.
Inverted head and shoulders pattern
Cup and handle (C&H) pattern
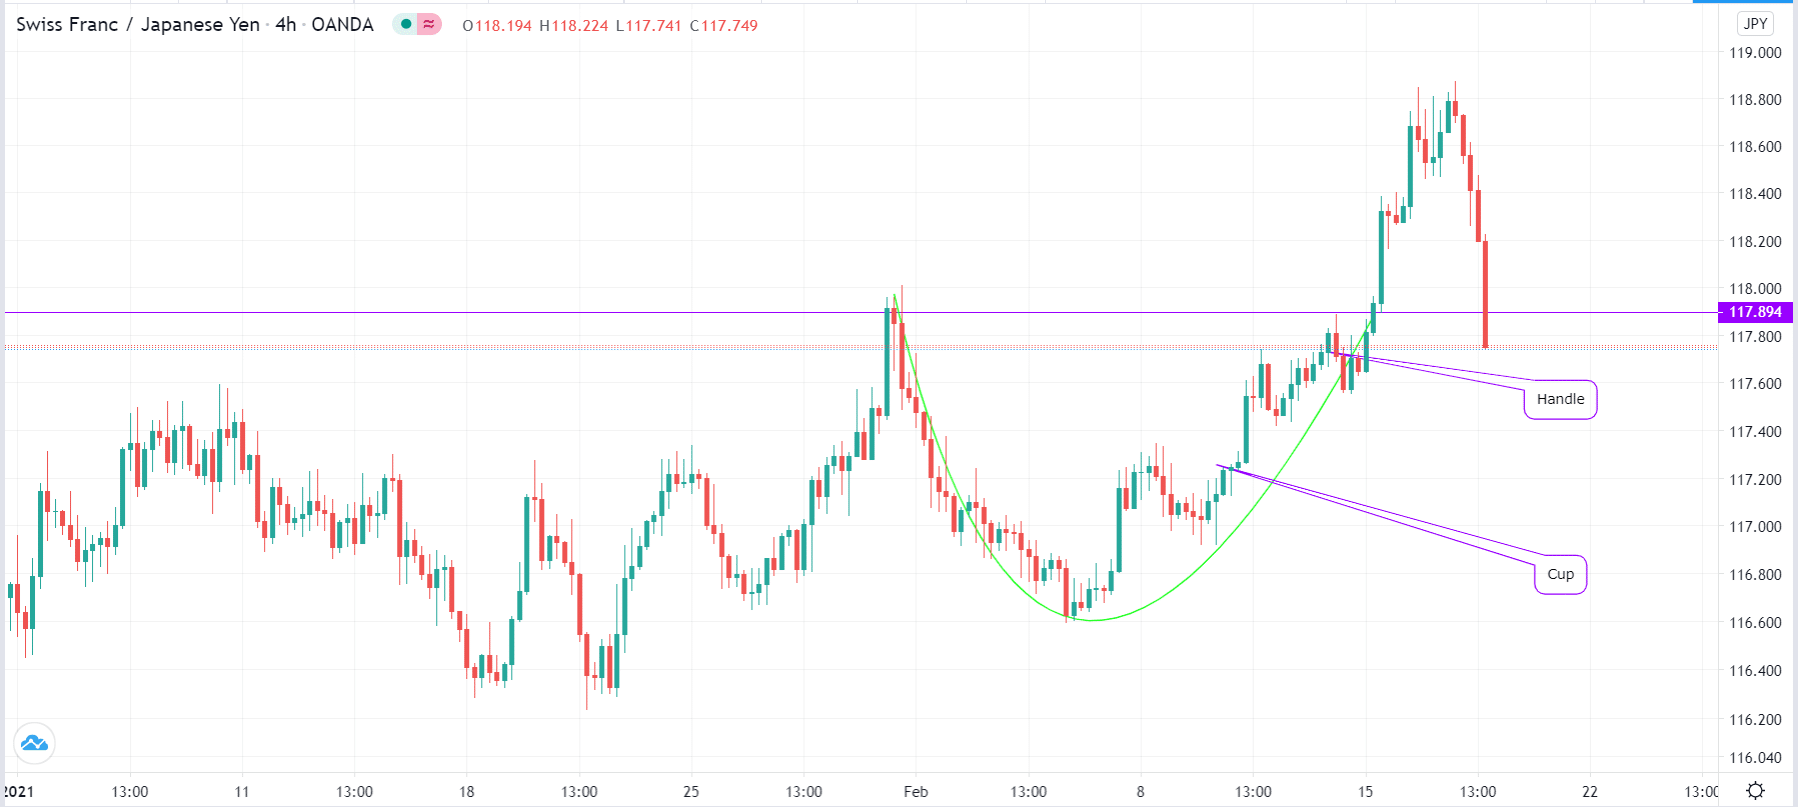
As the name suggests, the cup and handle pattern has a close resemblance to a real cup and its handle. The pattern starts when the price of a currency is rising. After reaching a certain point, it goes through a slow decline. After reaching a certain point, the price then starts a slow increase until it reaches the first top. At this point, the cup pattern has been formed. As traders ponder the next move, a consolidation or a small decline happens, which is now the handle. Ultimately, the price will break out higher. A good example of this is shown in the CHF/JPY pair below.
Cup and handle pattern example
Summary
Chart patterns are the foundation of any price action trading strategy. While the four patterns are the most popular, there are others that work equally well. Some that we have not mentioned are double top and bottom, wedge, and parallel channel.