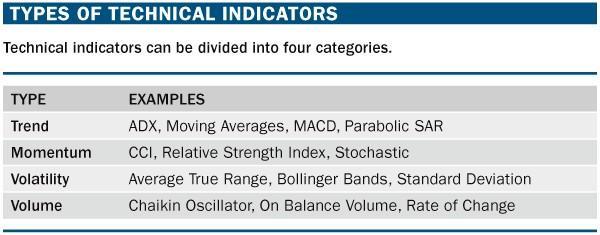
There are various forex indicators that highlight how volatile an asset is. However, none of them come close to the efficiency of the Average True Range as a trend strength indicator. In this guide, we take a look at all things regarding Average True Range and how it can be used by traders.
What is Average True Range
Average True range (ATR) is an indicator that highlights asset volatility. It indicates how much an asset moves during a given time frame, on average. When day traders are looking to initiate a trade, it helps them confirm and can also be used for the placement of a relevant stop-loss order.
The true range indicator is seen as the greatest of the following:
- Present High less the Present Low.
- Absolute Value of existing high less the preceding close.
- Absolute Value of existing low less the preceding close.
To get the average true range, we must first get the true range. True range is the largest value found by solving the following equations:
TR = H – L
TR = H – C.1
TR = C.1 – L
Where TR is the True range; H is today’s high; L is today’s low; and C.1 is yesterday’s close. The average true range is a moving average of the true ranges, generally used for 14 days.

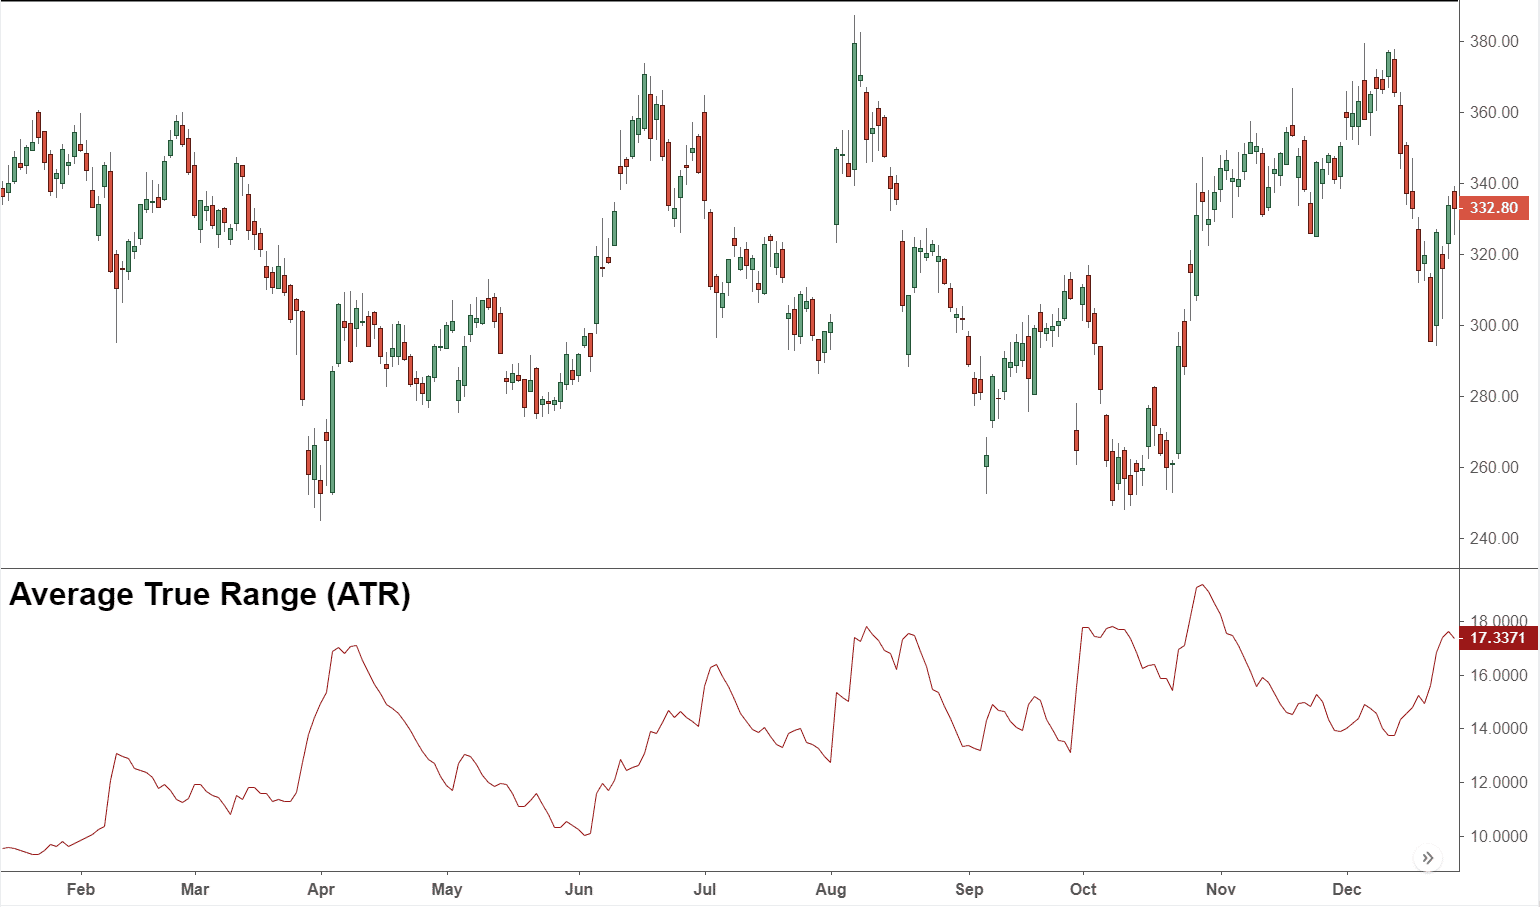
ATR is basically a continuously plotted line that is kept under the main price chart window, as is evident from the image above. The higher the ATR value, the higher the volatility levels. The ATR can be used by the market technician to enter and exit trades and is a useful tool to add to the trading system.
History of Average True Range
- Welles Wilder is accredited with the creation of ATR. It was mentioned in 1978 in the book New Concepts in Technical Trading Systems. The book further featured many other of the indicators that are considered classics such as the Average Directional Index, The Relative Strength Index, and the Parabolic SAR. Similar to the other indicators, ATR is used widely still and is of great importance for technical analysis.

The ATR was created to allow traders to more accurately measure the volatility of an asset using simple calculators. The lookback period for using the ATR is at the trader’s discretion. However, the period of 14 days is the most common. Similarly, ATR is used for varying periods such as daily, weekly, intraday, etc. But the daily period is typically used.
How Average True Range can be adjusted and how is it useful for automated trading
Although Wilder used a 14-day period for the ATR to explain the concept, traders can shorten or lengthen that timeframe according to their trading preference.
In essence, timeframes that are longer will be slower and generate fewer trading signals. On the other hand, timeframes that are shorter increase trading activity.
It should not be ignored that ATR is calculated based on absolute values of price differences. It means that securities with higher price values inherently have high ATR values. Similarly, those with lower price values have lower ATR. Trading robot should be adjusted to compare multiple security ATR values.
ATR is open to interpretation as it is a highly subjective measure. What is considered by one to have a high ATR value or security may not be the same for another security. That is why an automated trading software should screen the ATR relevance for each security while performing price analysis.
Furthermore, since there isn’t any single ATR value that tells with any certainty whether a trend is about to reverse or not, ATR should be used as a trend strength indicator, and its readings should always be compared against previous ones.
Basic Strategies using Average True Range
Trading robots can use ATR to acquire information on the degree to which an asset moves typically in a certain period. This is ideal for those who want to plot profit targets as well as determine whether or not they should try to trade.
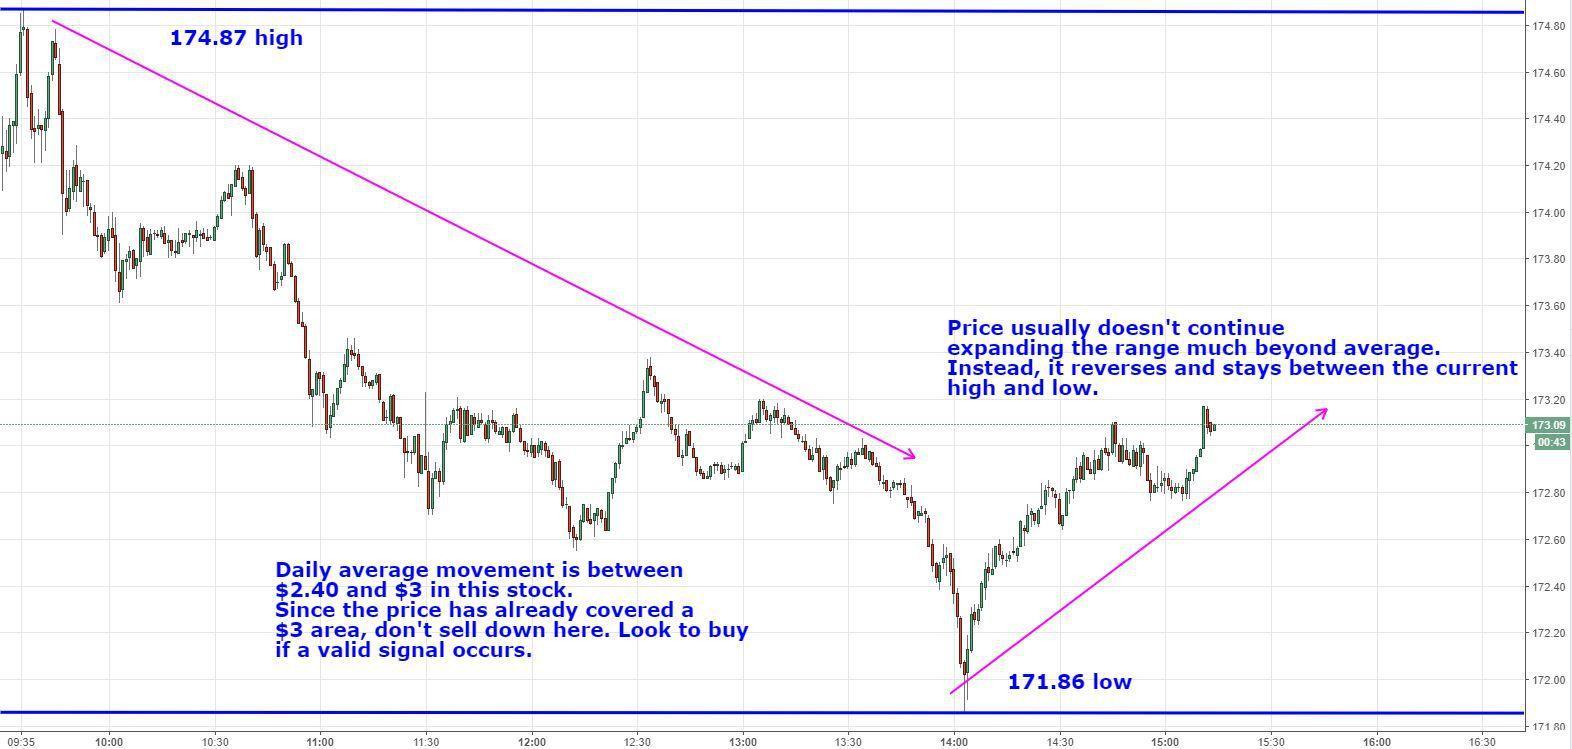
For instance, let’s say there is a currency movement on average of 0.005 a day. The pair moves up to 0.006 on the day without any significant news and the range is up +0.001. As such, the price moves 20% above average and you get a valid buy signal. However, as the price has already gone way above average, it wouldn’t be prudent to bet that the price will keep going up.

The price is more likely to fall since it has already gone up substantially and moved past the average. At such a stage, it would be better to sell or short, assuming there is a valid sell signal.
Day Trading
When you’re utilizing the ATR on an intra-day chart, the ATR will rise sharply after the market opens.
After this initial spike, ATR declines throughout the day. The slight oscillations do not provide much information throughout the day. The way they use daily ATR to see how the asset moves in a day, daily traders also use one-minute ATR to see how the price moves in five or ten minutes. This strategy is good for establishing stop-loss orders and profit targets.
ATR Trailing Stop Loss
Trailing stop loss allows a trading robot to exit a trade when the price moves against the initial position. It also lets EA to increase gains and move the exit point if it is in our favor. Automated software can use ATR data to determine where to establish a trailing stop order.
During the trade, assess the recent ATR readings. According to one heuristic, in order to determine a reasonable stop loss point, multiply the ATR by two. You might want to place a stop loss at twice the ATR level below the entry price. For shorting, place a stop loss at twice the ATR level above the entry price.
If the price moves favorably, continue moving the stop loss to twice the ATR level below the price. In such a scenario, the stop loss only moves up, never down. As it moves it, it stays there until it moves further up. Then trade closes because of a price drop to the trailing stop loss level. For a short trade, the same process works, except the stop loss moves only down.
For instance, let us say that you have a long trade of $10 and the ATR is $0.10. Going by what’s discussed above, you place a stop loss at $9.80 (that is 2 * $0.10 lower than $10). Now the price rises to $10.20 while the ATR remains at $0.10. You move the trailing stop up to $10. As the price moves up to $10.50, the stop loss moves to $10.30, thereby locking in at a 30-cent profit at least. This continues until the price falls to the stop-loss point.
The bottom line
ATR is truly a resourceful tool that measures the volatility of an asset and provides entry and exit locations to traders. The beauty of such forex indicators is that from their single idea, entire trading systems can be built. Those who are serious students of the market would do well to study this trend strength indicator.