Double tops and double bottoms are some of the most common chart patterns that traders and forex robots look out for, in technical analysis. Whenever the two patterns appear in the market, they signal a potential trend reversal.
Double Top
A double top is a chart pattern that occurs when the price moves upwards for an extended period. Exhaustion tends to kick in as soon as price extends for long, signaling overbought conditions. In this case, the top is a peak that forms whenever price hits a certain level that can’t be broken further.
Once price hits a given peak, it tends to reverse in the opposite direction. However, given the strength of the prolonged uptrend, the price would often bounce off given support or neckline and start moving upwards again.
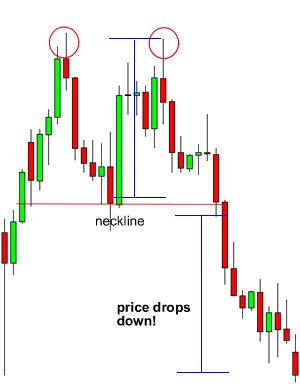
Upon touching peak level, for the second time, the price would often experience strong resistance, reverse, and start moving lower, resulting in the formation of a W chart pattern. A breach of the support level or neckline on a second trial would often signal trend reversal from an uptrend to a downtrend, thus the double top chart pattern.
Automated trading systems, as well as technical traders, use this opportunity to enter sell positions, below the neckline on the formation of the double top pattern.
Double Bottom
A double bottom chart pattern is the opposite of the double top as it forms when price moves lower for a prolonged period. Once price plunges into oversold territory, exhaustion kicks in, and the price starts bouncing off the lows conversely moving upward.
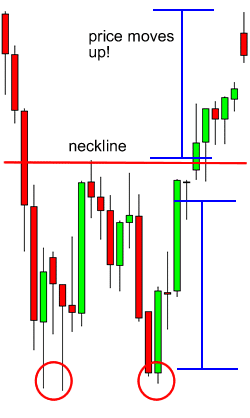
However, the first move upward often experiences strong resistance at a neckline level, as shown above. In this case, the price would, at times, try to move lower in continuation of the long term downtrend.
A push lower on the second trial would often experience some resistance with the influx of buyers into the market. Conversely, the price would often reverse and move higher, breaking through the neckline level.
A breach of the neckline level on the formation of the double bottom affirms trend reversal. In this case, forex expert advisors, as well as technical traders, would often look for buy opportunities as price tends to move upwards from the lows.
Hedging Strategy for Double Tops and Double Bottoms
A double top or double bottom hedging strategy differs from scalping, trend trading, or news trading because it entails the setting up of two trades at a given time. One of the trades acts as the immediate execution trade, while the other acts as an insurance policy or hedge should the immediate trade fail to behave as expected.
Hedging allows traders to protect open positions generating significant losses due to short term adverse events in the market.
Double Top Hedge
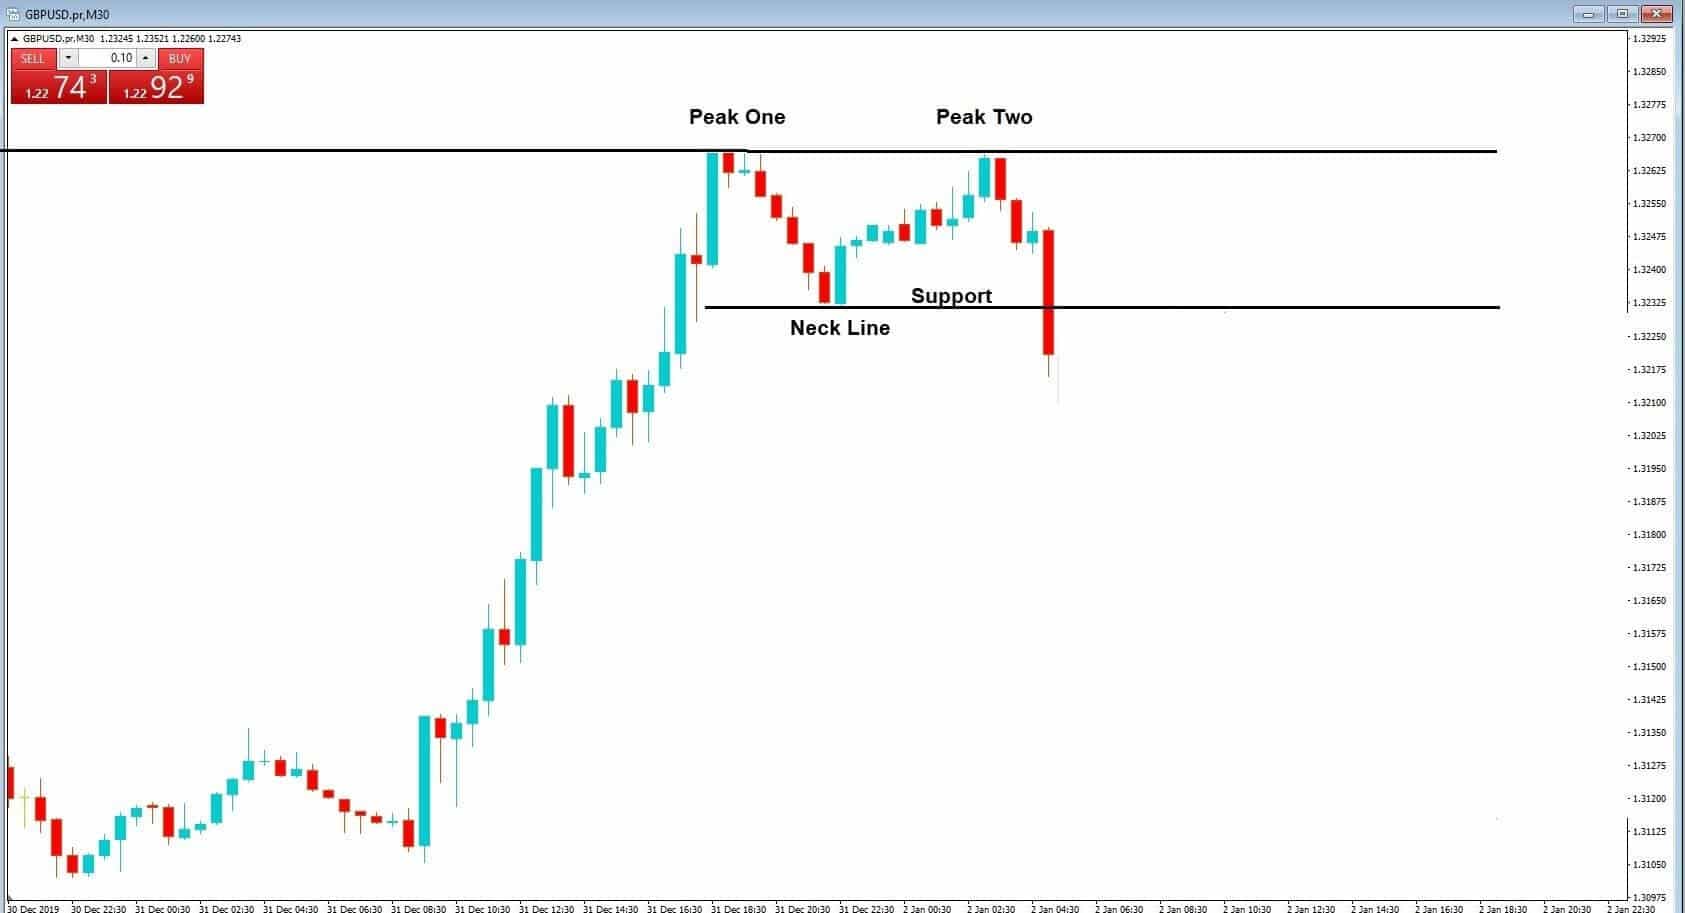
The chart above signals a double top chart pattern indicating the price has reversed and set to continue edging lower. In this case, traders can enter short positions below the neckline to profit from the new move down.
However, at times price struggles to move lower as expected due to renewed buying pressure in the market. In this case, traders or robots deploy the double top hedge strategy to protect the short positions that are already open to ride the wave downward.
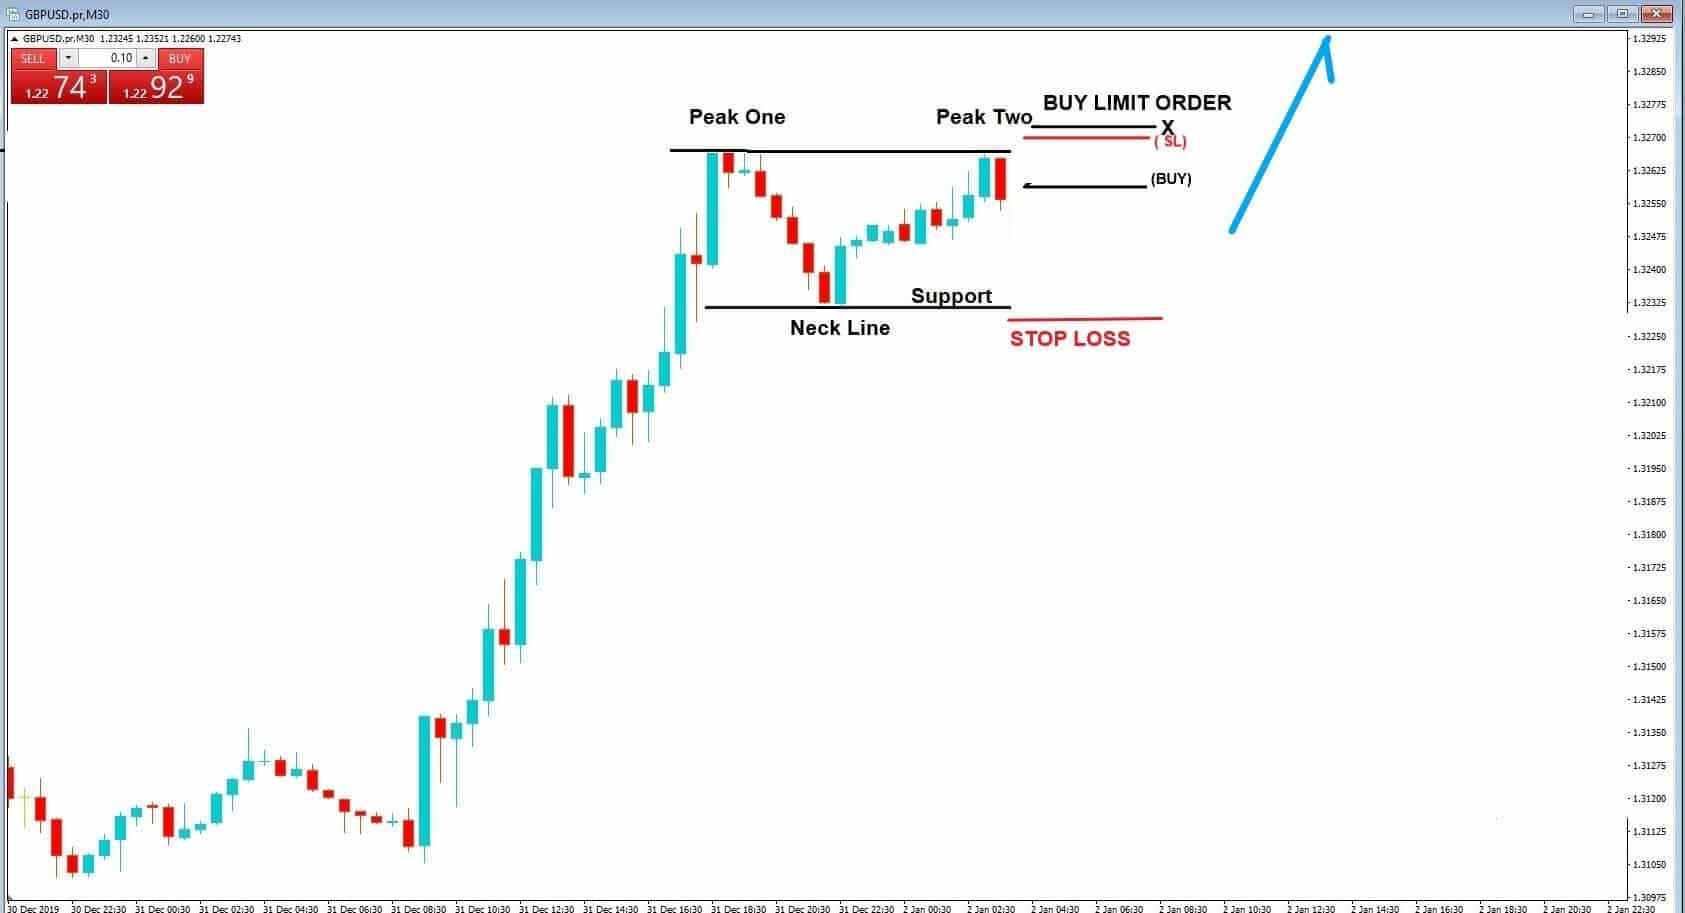
As shown above, one can set a buy limit order above the ‘peak two’ levels with a stop loss at the neckline level. If the price reverses and starts moving upward, after the opening of a short position below the neckline, a trader would be able to accrue some profits on the second position being triggered above peak level.
Double Bottom Hedge
In the double bottom hedging strategy, forex trading instruments and technical traders, reverse the trade set up for the double top hedge. An important forex trading secret is to enter long positions above the neckline once a double bottom occurs. The double bottom chart pattern signals that the downward trend has reversed, and that price is likely to reverse upwards.
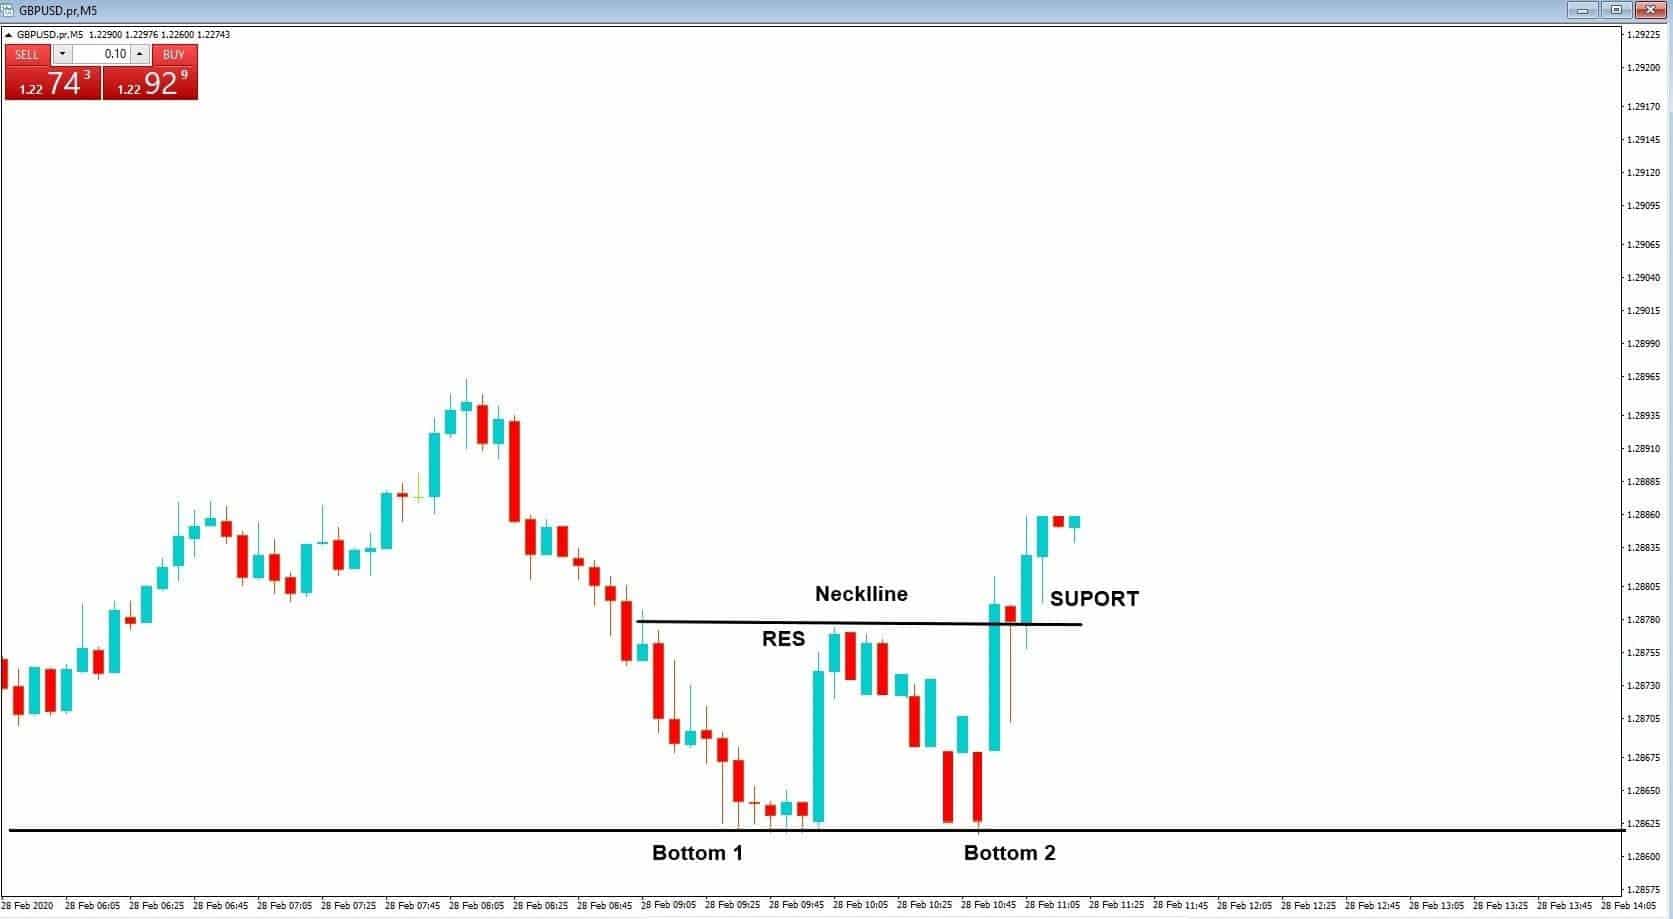
In the chart above, it is clear that the price reversed from the downtrend and is set to edge higher on breaking through the neckline. However, in some cases, the price would struggle to move upward despite the formation of the double bottom. In this case, EA moves to profit from the double bottom hedge.
For the double bottom strategy, a trader or a forex robot could place a sell order below the ‘bottom 2’ level. In this case, the second trade will act as a hedge on the buy position opened to profit on price moving higher upon trend reversal from the double bottom chart pattern.
The sell position triggered below the bottom 2 level would accrue profits on price moving downwards. Conversely, it would be a hedge to the first buy position.
Conclusion
Double top and double pattern hedging strategy are some of the best strategies for profiting on price reversals in the forex market. As a crucial money-making hack, the two strategies should be reserved for 15 minute time frames as it is here where one is likely to accrue the most pips.