The Moving Average Convergence Divergence shows a move’s strength by comparing two MAs of a currency pair’s price. Since it relies on these two MAs, it is lagging. It helps point out the beginning of new trends and the culmination of an existing movement. There are several ways of obtaining signals from this tool, which inform the strategies we shall discuss herein.
Mechanics of the MACD
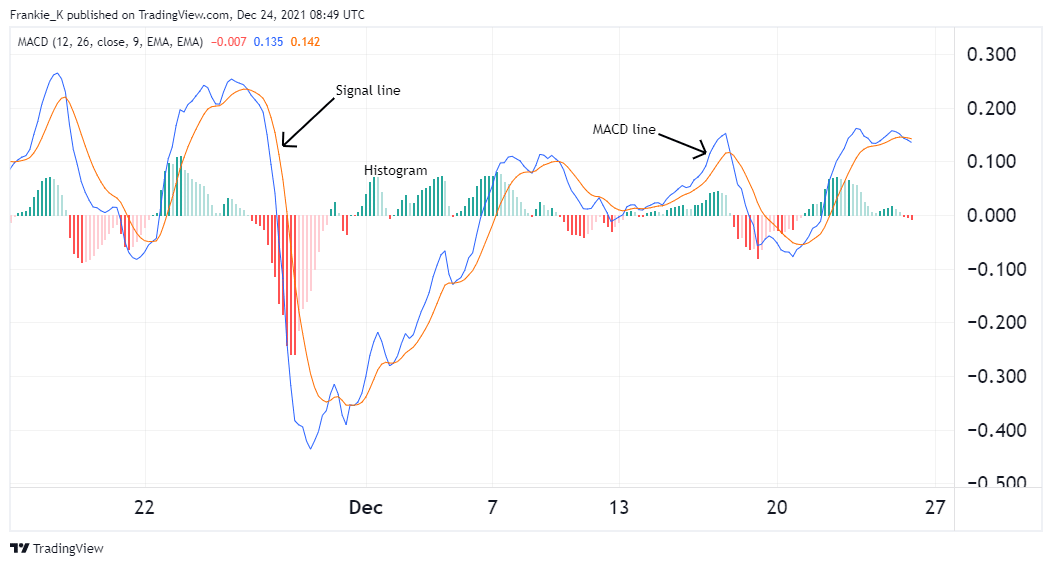
Most charting platforms often display this indicator on an independent chart window. More often than not, it will be placed below the main chart. It is made up of three components: two lines and a histogram.
The first line is called a MACD line. By default, it is the quicker Moving Average. Therefore, it will typically oscillate above and below the second line, which is aptly named the signal line. The latter is the slower MA, and it is used to provide signals for the indicator, just like typical MA crossovers. The third component is a histogram, whose bars represent the distance between the two MAs. Depending on whether the MACD line is above or below the signal line, the bars will be formed above or below the zero line, respectively.

The image above shows how it works. Notice how the histogram oscillates above and below the zero line.
What are the best settings for the MACD?
From the above illustration, you can see that MACD came with 26, 12, and 9 settings. These are the default settings for the tool. 12 and 26 are the settings of the MACD line, while 9 is that of the signal line. The former line is obtained by calculating a 12 period EMA of the price and subtracting a 26 period EMA from the result.
On the other hand, the signal line is obtained by calculating a 9 period EMA of the MACD line. Therefore, in essence, the signal line is a smoothed version of the MACD line, so it tends to be slower.
How best to trade MACD signals
1. Trading crossovers between its two lines
This is the most widely used signal. It appears as the move of the MACD line above or below the signal line, much as other MA crossovers. When this line goes from below to above the signal line, it shows the start of a bullish trend. As a result, this phenomenon is referred to as a bullish crossover. When the MACD moves below its counterpart from above, it signals the start of a decline. As a result, this is referred to as a bearish trigger.

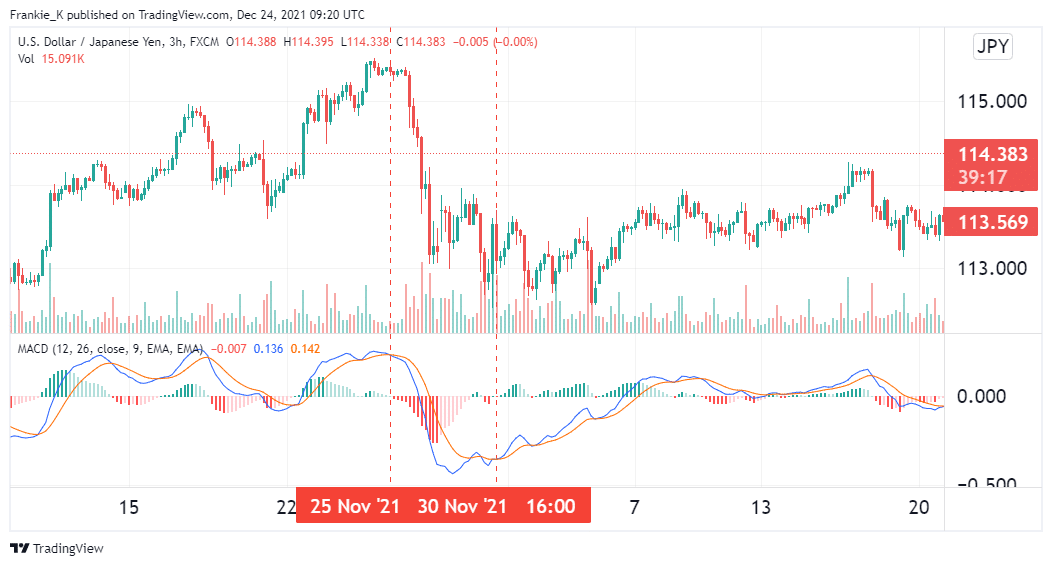
The above USDJPY chart shows a bearish MACD crossover manifest on November 25th, just before the pair embarked on a drastic downtrend. This was the signal to go short on the pair. A suitable stop-loss should be placed a few pips above the swing high preceding the downtrend.
The exit came a few days later when a bullish crossover occurred on November 30th. The bullish crossover signified the end of the downtrend, which was the signal to take our profits and close our short position.
2. Trading divergences
Another easy way of trading this signal is watching out for divergences between the MACD and the price chart. A divergence simply means that it does not move in unity with the market. A bullish divergence would manifest as the indicator’s lines making upswings while the price chart was in a downtrend. This would indicate a bullish reversal is in the works, and after the reversal starts, it would prompt us to enter long trades.
A bearish divergence would be the opposite, i.e.; the MACD would be trending downwards while the price chart trends upwards. This would signal an incoming bearish reversal, hence presenting the perfect opportunity to enter a short trade.

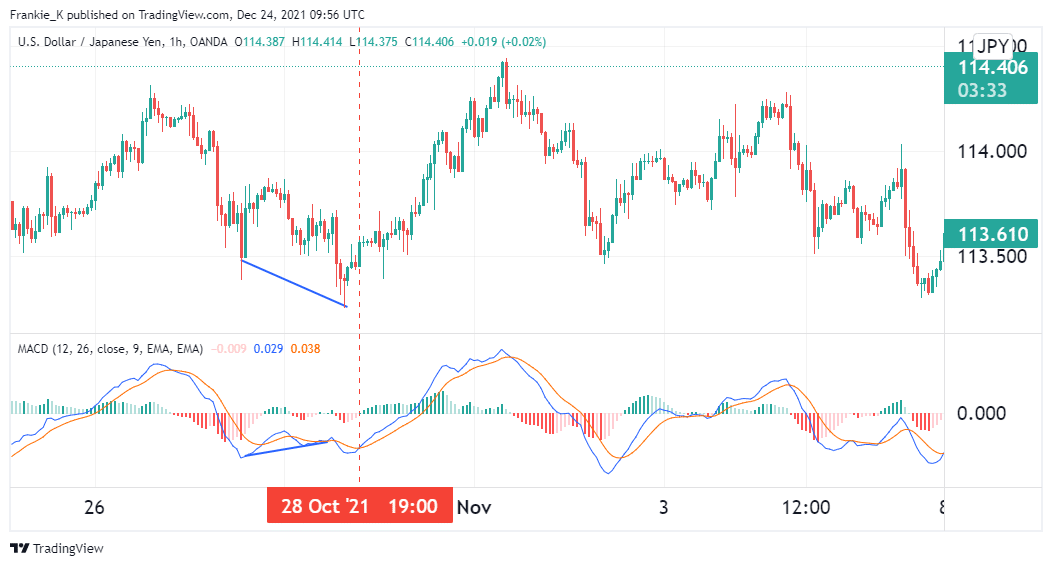
The example above shows a MACD divergence manifesting in an hourly USDJPY chart. Prior to the 28th of October, the pair’s price was in a downtrend, as highlighted by the blue trendline on the price chart. However, the indicator was in a slight uptrend during the same period, which indicated that the pair was set up for an uptrend. True to this signal, the pair went on a rally on the 28th, which gave the suitable entry for a buy trade.
How to utilize the MACD best
We have discussed two types of signals from this tool – crossovers and divergences. Unfortunately, it is not uncommon for the tool to give false signals, mainly when used solely. For that reason, it would be wise to utilize it in conjunction with another indicator such as the Relative Strength Index (RSI), Bollinger Bands, or use it together with lines of support and resistance. This way, you can confirm the signals you get from the MACD and improve their chances of success.
Another thing to remember is always to make use of stop-loss orders. That way, in case you trade a false signal, the stop loss can deal you out of the trade before you suffer irrecoverable losses. Place the stop loss above the most recent swing high when trading bearish signals. Similarly, if you’re trading bullish MACD signals, place your stop loss below the most recent swing low. Take-profit levels are typically identified when the indicator makes the opposite crossover from that at the entry.
Epilogue
If you intend to use the MACD to trade forex in 2022, you should look for bullish or bearish crossovers or divergences between itself and the price chart. Further, since the indicator is not immune to false signals, you should consider using it with other tools, as this would significantly improve your signal accuracy. Additionally, risk management measures such as employing stop losses are of paramount importance.