Moving Averages (MA) is a simple technical analysis tool. This leads to widespread popularity among traders with various skill levels. Consider what moving averages are, how the indicator is calculated, what its indicators depend on, and what are the pros and cons of this indicator.
What is Moving averages
MA is commonly used for currency pairs, stocks, and bonds. The main objective of this indicator is to cut off fluctuations and find the main stable trend. Using this indicator, the trader can measure the strength and direction of the price movement, determine the entry spot, and target price for the better trade execution.
MA’s are calculated for any period – from the smallest to the largest. Most popular MAs for momentum trading are short ones: 9-day or 21-day MAs are great if you are following the fast trend which is accompanied by high volume. While 50, 100, and 200-day moving averages are more used by funds and institutional investors. To figure out if the currency is undervalued or overvalued, and what is long term sentiment for this particular asset right now. The price holding under the 200MA for a long period of time is a sign of a strong downtrend. In the analysis, try to use several lines at once, for different periods. Here is the list of main MA types:
- SMA;
- MMA;
- EMA;
- WMA.
In exchange practice, they are used – simple (SMA) and exponential (EMA). Moving average calculation is simple: divide the sum of closing prices by the number of settlement periods. The result is presented in a smooth price curve. The smoothness of the line will be affected by the size of the period – the smaller it is, the more broken the line will be.
History Moving averages
MA in the Forex currency market is one of the indispensable trend indicators. It is the basis of many profitable indicators. When calculating it, mathematical averaging of the price of an instrument for a selected period is used.
This is the oldest indicator that has ever been used in trading. It was first used in the early 40s for strategic calculations during the Second World War. The authors of the indicator are scientists Richard Donchian and J. M. Hurst. Today, there are several main varieties of MA that you can find in any trading terminal and analytical program, as well as a ton of filters written using a similar algorithm or based on a moving average.
How it can be adjusted, and how is it useful for traders
Most online brokers have trading platforms where you can add MA as one of the indicators for technical analysis. You can also design a custom line on a live graphic. It is worth noting that you can choose a period that covers a certain number of days. A smaller amount means greater accuracy in the short term if there is a significant bull or bear trend. If the trend is weak – short term moving averages can provide false signals for traders. That is the case to use more long term MA or switch your attention to another indicator. Also, most trading platforms offer to choose the type of MA. This is mainly about 4 indicators that can be simultaneously applied to the chart.
Lines can be marked with colors and indicate thickness. There are also separate extensions for MetaTrader 4 and 5. They allow you to set predefined presets for trading. You can install the trading terminal on your computer and download special software that will automate this process. You can also use automatic robots that will allow you to download ready-made settings or set manual parameters.
A moving average is useful for traders which uses its bundles with additional indicators. This indicator in itself may not give accurate signals. It is worth combining it with several parameters as well as support and resistance lines. This will help you enter the transaction more accurately each time.
Basic strategies, using Moving averages
When novice traders open a chart of a currency pair, it seems to them too chaotic and chaotic. Some candles are very sweeping and with long tails (shadows), while others are short and narrow.
When price impulses follow one after another in different directions, all this may lead the beginner to confusion. But here is where the Moving Averages indicator comes to the rescue. It is used not only by novice traders but also by professional participants in “financial battles”.
As we said, the moving average is the average price of a financial instrument for a certain period of time. So for example, a moving average with a period of 50 will show the average price for the previous 50 candles.
When this indicator is plotted on the chart, the analyst sees a smooth line that smooths out the chaotic noisy price movements. Thus, he quickly understands where the trend is heading:
- if the sliding line is directed upwards, then the uptrend is in effect on the market;
- if the moving average is directed down – the market is most likely dominated by “bears”.
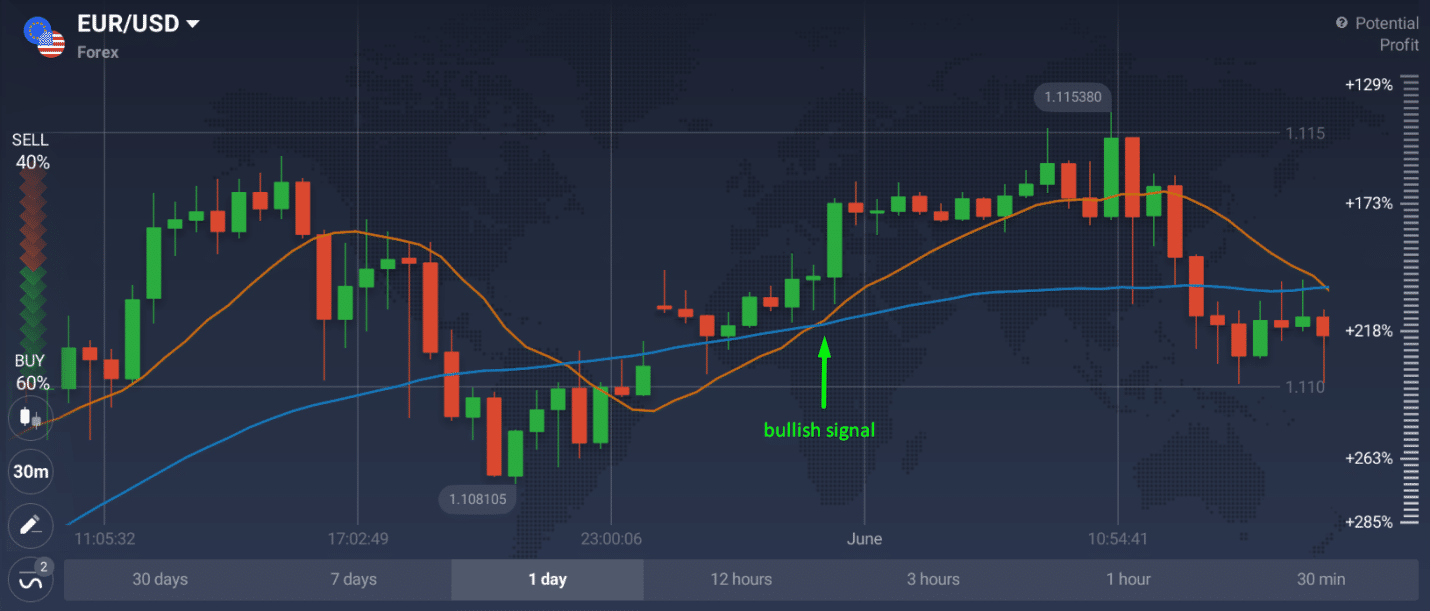
The basic strategy for any newcomer is MA crossover. You must enable the trading terminal and install two MAs. We need fast MA and slow MA. A market entry signal is generated when a fast MA crosses a slow MA. Accordingly, we buy when the fast MA is from above, and sell when the fast MA is from below. Here is a trading example:

In this case, fast MA crossed slow MA and rushed up. This is a buy signal. You can experiment with the sensitivity of MA and customize them as you wish. Now let’s look at the bearish signal.

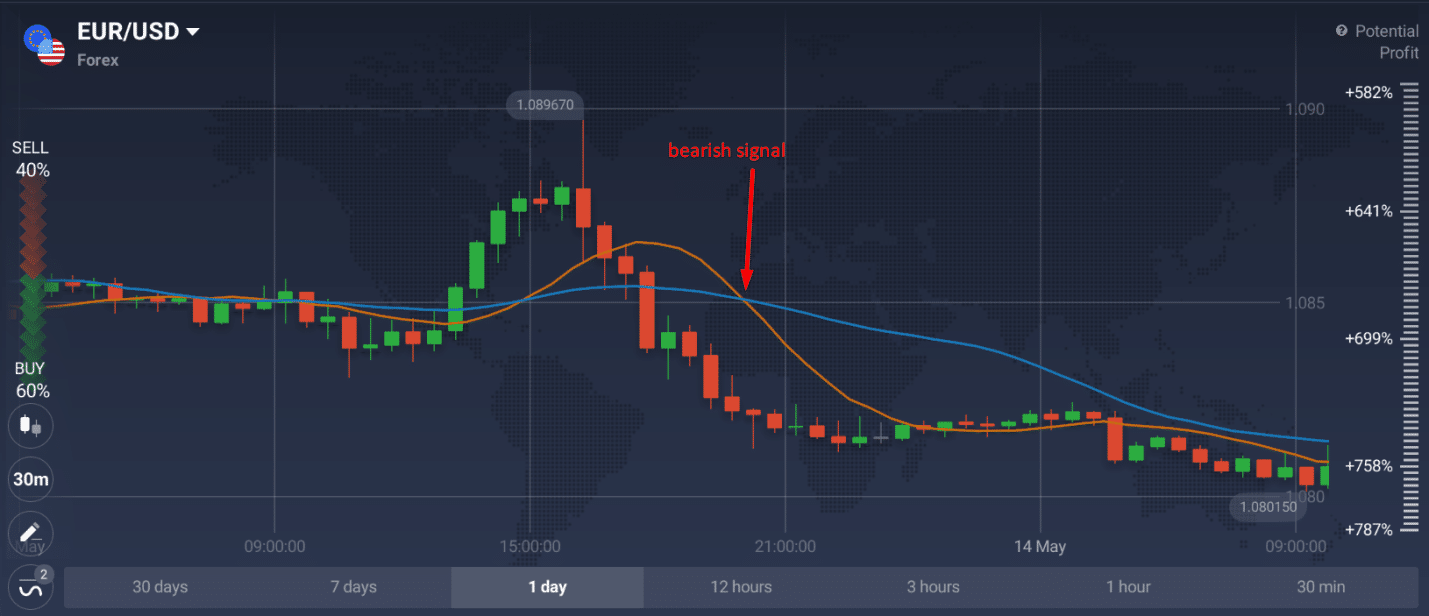
Here, a downtrend with lateral movement is clearly visible. This is a clear flat and fast MA crossed slow MA and rushed down. In this situation, you need to sell. Despite the small bodies of candles, timely entry into the transaction can lead to a good profit.

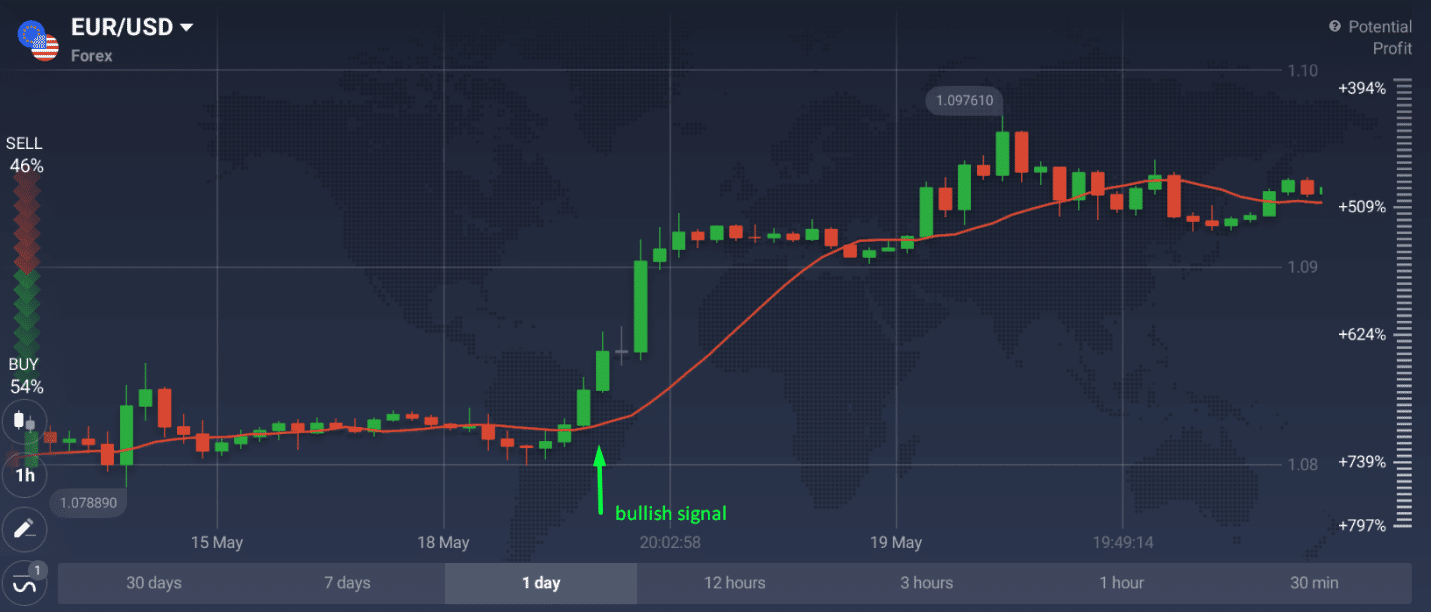
Here is another example of a good bullish signal. In this case, we use a more simplified strategy that uses only one MA. The period is worth choosing depending on the timeframe and currency. Here it is clearly seen that after a protracted lateral movement 2 green candles began to appear. As soon as we see a full third candle that crossed the line, we open a deal to buy. In this case, there is a high trend movement that will allow you to adjust the price and get enough points of profit. Even if you were late to place an order for several minutes it is all the same but it may turn out to be profitable.

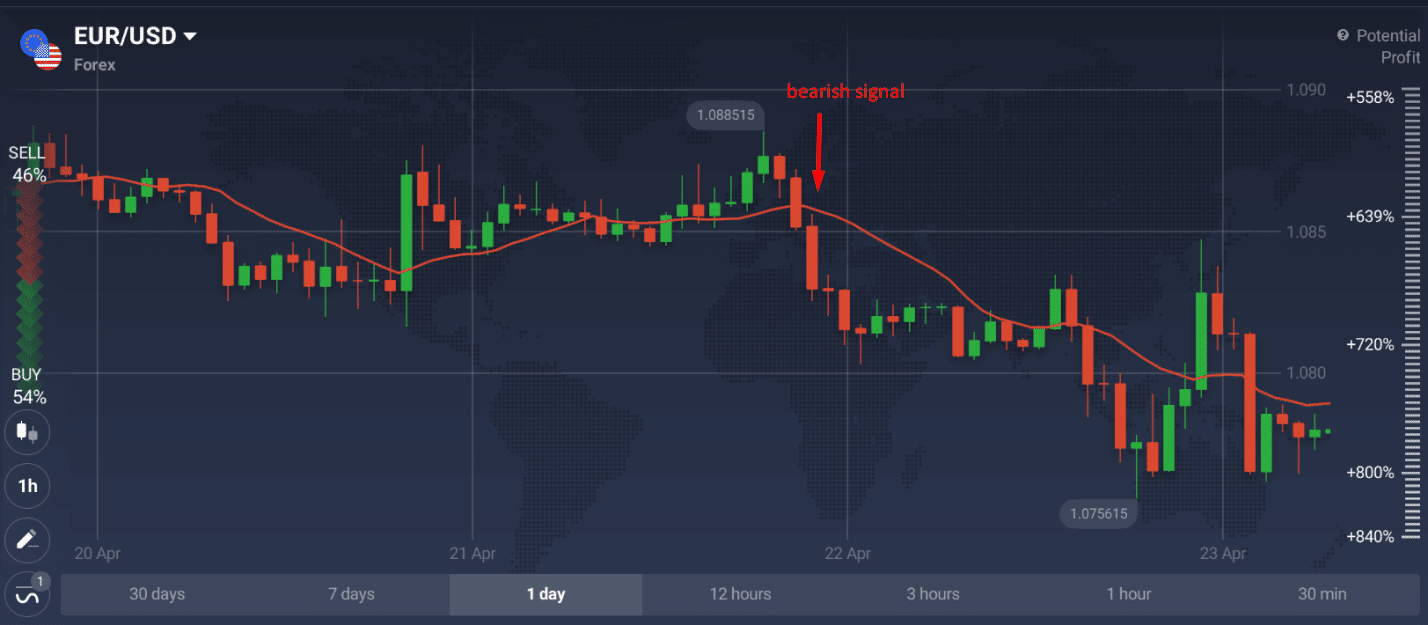
The second situation with one MA is clearly shown in the following graph. Here we see that the price worked out the previous maximum and there was an adjustment with lateral movement. After the price came to the previous value, a sharp rollback began. We receive a sell signal as soon as 2 red candles crossed the MA line. This obvious Bearish movement needs to be worked out in a good plus. As can be seen from the chart, it was possible to conclude both a relatively short-term transaction and a long-term sale, which would ultimately be reflected in a significant profit, with a comparably small risk. Stop orders should be placed below or above 2 candles, which show us the direction of the trend.
Final Words
MA is a classic indicator that has been used by many traders for decades. In conjunction with additional indicators, this can become the basis of trading strategies for beginners and experienced traders. It is very important to set the correct periods that span a certain number of days. In this case, you can get a profitable trading strategy that will work in most cases.