The relative strength index (RSI) is a leading indicator that is plotted on a separate window below the price chart. It consists of a single line oscillating between a vertical scale of 0-100. This line measures the variation of the current price from its previous values.
How to calculate the RSI
The formula to obtain the relative strength index goes as follows:
RSI=100 – (100/ (1+U/D))
U is the average number of price increases, while D is the average number of price declines.
This formula boils down to if price rises in relation to its previous values, so do the index, and vice versa. A reading of 0 may happen during a strong continuous downtrend, while 100 happens when the price has been in a strong uptrend.
Usually, a reading of above 70 signifies that the currency pair has been overbought. This could point to an impending downturn for its price. On the other hand, an RSI of below 30 means the pair has been oversold, and a bullish reversal can be expected. Further, a divergence between the direction of the RSI and price movement often signifies that a reversal is imminent.
For signal confirmation, RSI is often used together with other indicators.
RSI trading strategies
1. RSI and RVI strategy
The Relative Vigor Index (RVI) is an oscillator just like the RSI. However, the RSI focuses on price highs and lows, while RVI relates closing prices to open prices. To this end, the RVI has a vertical scale with a positive and negative side and a zero at the centerline. The RVI denotes the strength of the momentum of price movement.
A positive reading signifies rising momentum, while negative readings translate to a weakening momentum. Traders often look for divergences between it and price movement to generate signals.
For example, if the market was bullish and the RVI was declining, that’s a bearish signal. If such a signal coincided with an RSI reading of above 70, the bearish reversal is confirmed, and one can open their short positions.
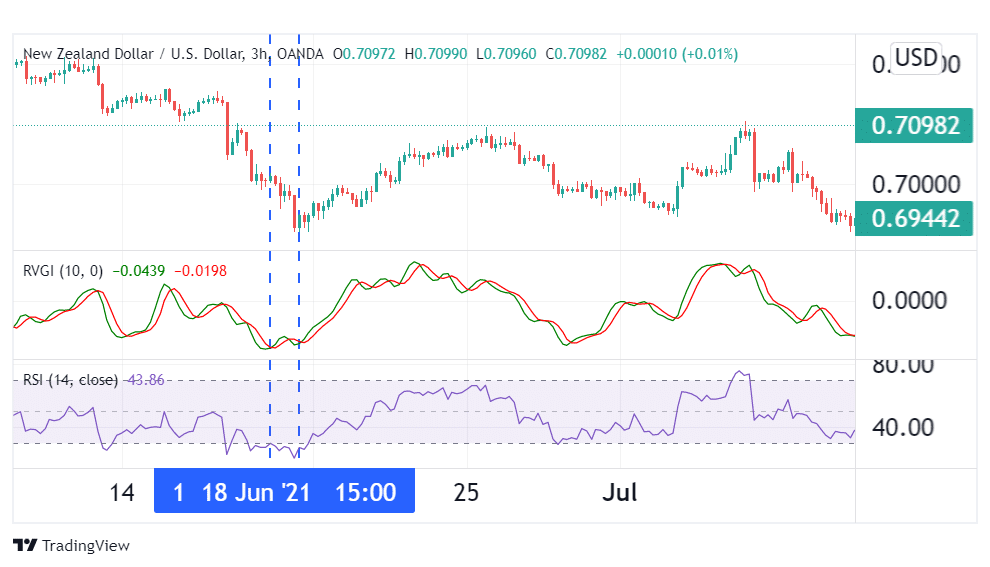
From the example above, we can see the scenario on 18th July when the NZD/USD pair’s price kept falling, while the RVI recorded a slight spike. In addition, the RSI reading was in the oversold region. This is a confirmed bullish signal, and true to the prediction, the pair embarked on a strong continuous uptrend.
Therefore, the smart move would be to open a long position when the RSI crosses 30 from below. Using a larger time frame, find the next major resistance level and place your take-profit at that point. The stop loss may be put a few pips below the reversal bottom.
2. RSI and MACD strategy
The Moving Average Divergence Convergence (MACD) is a lagging indicator that measures the momentum of a price trend. It utilizes Moving Averages to follow price trends and can be used to confirm signals generated by the RSI. The MACD has a vertical scale with a zero centerline, with positive and negative regions on either side. Positive readings indicate an accelerating price trend, while negative scores imply the trend is losing momentum.
Further, the MACD contains a 9-period Moving Average line called the signal line. When the MACD line crosses below this line, it generates a bearish signal. Alternatively, when the MACD line crosses above the signal line, it generates a bullish signal.
Therefore, if the RSI reads above 70, denoting overbought market conditions, one can open a short position when the MACD makes a bearish crossover. Otherwise, if the RSI reads below 30 and the MACD makes a bullish crossover, one can go long as a bullish reversal is in the works.
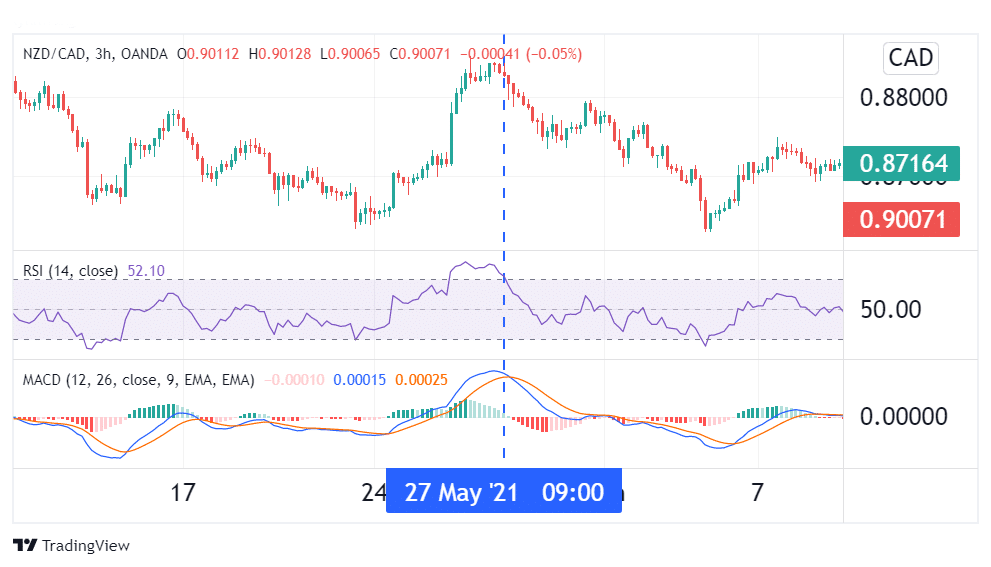
From the chart above, we can see that on the 27th of May, the pair’s RSI was in overbought conditions after a strong uptrend. Further, the blue MACD line crossed below the orange signal line, forming a bearish crossover. Both of these signals pointed to an incoming bearish reversal.
Once this signal was confirmed, the prudent move was to open a short position when the RSI crossed back below 70. As for the take-profit, one could put it at the next major support or wait until the MACD forms a bullish crossover pattern and the RSI hits the 30 mark. Either way, such a trade is bound to be successful.
3. RSI and Bollinger bands
Bollinger bands are an indicator that measures price volatility. During low volatility, these bands squeeze together. In high volatility periods, the bands are much farther apart.
Typically, consolidation periods precede massive breakouts. Therefore, a squeeze of these bands may signify an impending breakout. Using the RSI, the signal can be confirmed if its reading is in the oversold or overbought region.
For example, when the RSI falls below 30 and then starts climbing, that’s a bullish signal. You could open a buy trade when the price breaks out above the upper band.
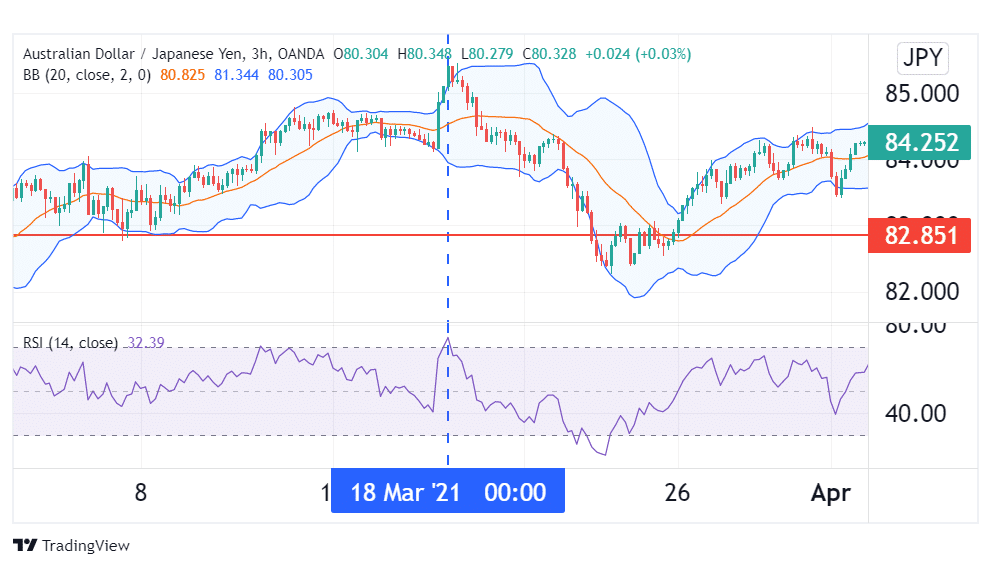
Alternatively, when RSI rises above 70, as in the chart above, it gives a bearish signal. One can wait until the resulting downtrend hits the bottom Bollinger band, then open a short position. The take-profit can be set at the next major support level denoted by the red line, with the stop-loss at the level of the upper band.
Upper and lower bands often act as resistance and support levels, respectively. Therefore, any breakout from these bands signifies an upcoming strong trend.
Key takeaways
The RSI is a simple and effective indicator for measuring the fluctuation of the current price from previous prices. It can be used to generate the buy and sell signals, but these are not always right. Traders can pair RSI with other indicators such as the RVI, the MACD, and the Bollinger band to improve signal accuracy. Using such indicator combinations in your trading is guaranteed to increase your probability of success exponentially.
In the first part of this article, we described the Relative Strength Index as an oscillator that measures the energy behind price movement. It is displayed on a different chart that is located underneath the price chart, and its scale runs from 0 to 100. When the RSI reads 70 or above, it signifies that the currency pair has been overbought. Similarly, a score of 30 or below indicates that the pair is oversold.
Let’s dive into more combinations of this indicator that are guaranteed to improve the success of your forex trades.
Combining the RSI and stochastic oscillator
The stochastic oscillator is very similar to the RSI in terms of operation. It compares a currency pair’s closing price to its price range over a given time period. While RSI is beneficial in trending markets since it reflects the level of incentive driving price movement, it is less effective in consolidating situations. This is due to the fact that it is less sensitive to price fluctuation than the stochastic oscillator.
The vertical scale of the oscillator ranges from 0 to 100. When it rises above 80, it indicates that our currency pair has become overbought. When it falls below 20, our currency pair is considered oversold.
When the RSI reaches the oversold zone, it signals the start of a new upward trend. However, this indicator is not always correct, as prices have been known to continue falling after the RSI signaled that they were oversold. We utilize the stochastic indicator to confirm that our pair is indeed oversold as a confirmation. When both indicators return to their threshold values after falling below them, a bullish reversal is significantly more likely.
Similarly, when the RSI indicates that a pair is overbought, a decline is likely to follow. We can validate the veracity of our bearish flag with our other oscillator, increasing its odds of success.
Divergence is another signal that the RSI gives. A divergence occurs when this oscillator moves in the opposite direction of price movement. This occurrence usually signals the start of a trend reversal.
For instance, when price makes lower lows while RSI makes higher lows, this shows that bears’ momentum is growing weak. This is usually a sign that the currently falling price is about to embark on an uptrend. Similarly, when prices are hitting higher highs but the RSI is hitting lower highs, that’s a sign that prices are about to plummet.
Similarly, a divergence between the stochastic oscillator and price points to an incoming trend reversal.
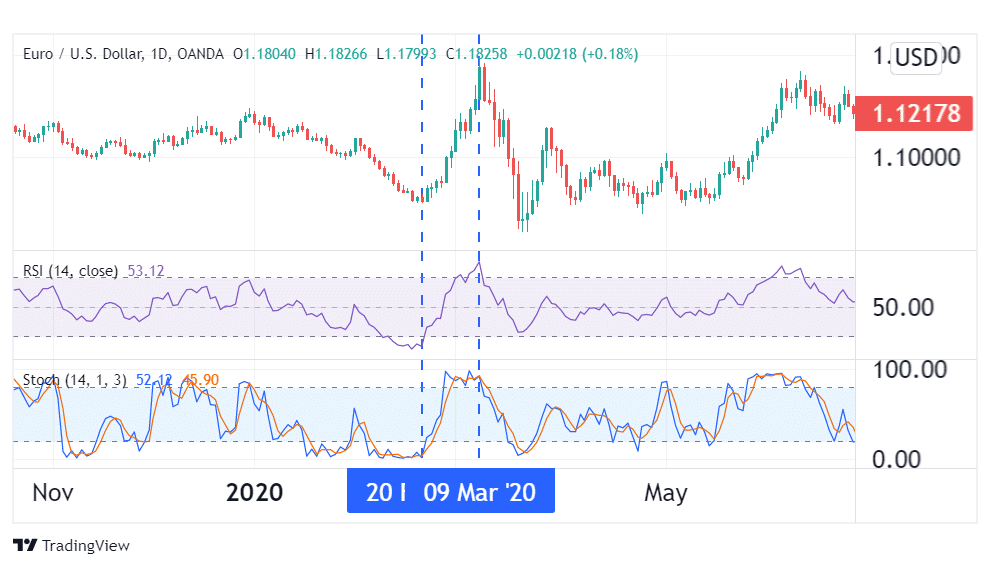
From the example above, we can see that both indicators showed that the EUR/USD pair was oversold on 20th February. This is a confirmed bullish reversal pattern. Therefore, you can open a buy trade when both indicators rise from below their threshold values.
For take-profit, you may either use the next major resistance level, or wait until both indicators signify overbought conditions, which happened on the 9th of March. The latter tends to yield more profit. Put your stop-loss a few pips below the first reversal’s support level, depending on your desired risk to reward ratio.
A blend of RSI and Moving Averages
Moving average is a lagging indicator that compares prices to their averages over a specified period. Since RSI is a leading indicator, any trade signals it generates can be confirmed using the MA.
By using two MAs, with one moving slower than the other, we can generate crossover signals to signify trend reversals. Usually, the shorter period crossing below the longer period MA gives a bearish signal. Alternatively, if this faster MA crosses above the slower MA, it constitutes a bullish flag.
Since Exponential Moving Averages tend to follow prices more closely, we’ll be utilizing them for this strategy. Additionally, it is recommended to use short-term EMAs like the 5-day and 10-day EMA.
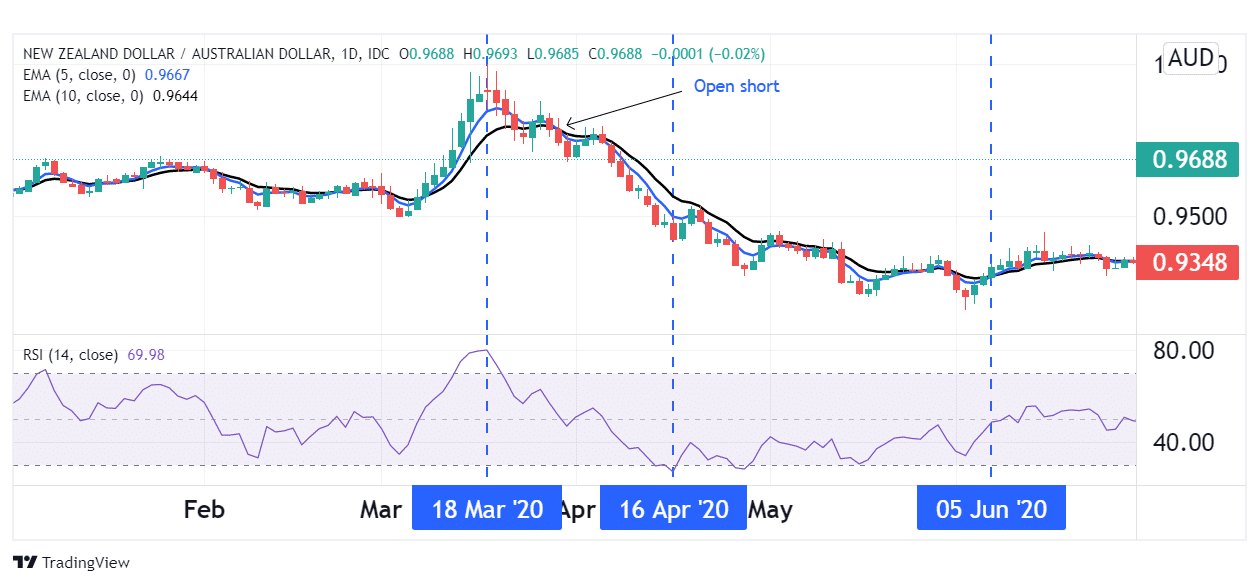
From the example above, we see the NZD/AUD pair was overbought on 18th of March. This signified a possible bearish trend beginning. A few days later, the blue 5-day EMA crossed below the 10-day EMA displayed in black. This confirmed the bearish trend and gave us our short entry position.
On the 16th of April, 2020, the RSI gave a signal that the pair was oversold and our bearish trend was ending. This was not confirmed by the Moving Averages, and it turned out to be a dead cat bounce. On 5th June, our bullish crossover finally happened, signifying the end of our bearish run. Incidentally, the RSI started rising, indicating the bulls were gaining momentum. This confirmed the beginning of the bullish run, and gave our take profit. For this strategy, we could use the prior resistance level as our stop-loss.
The trifecta: RSI, stochastic indicator and Moving Averages
Using a combination of these three indicators, we can improve the accuracy of our trade signals even further. For this strategy, we need to satisfy the following optimum conditions:
- A 10-period MA.
- A default settings RSI.
- A default settings stochastic oscillator.
Since the moving average follows prices, it creates a buy signal when price crosses above the MA line. This can be confirmed by the RSI and stochastic oscillators both showing oversold conditions. Alternatively, when price crosses below the MA line and our other two indicators show overbought conditions, that’s the signal to go short.
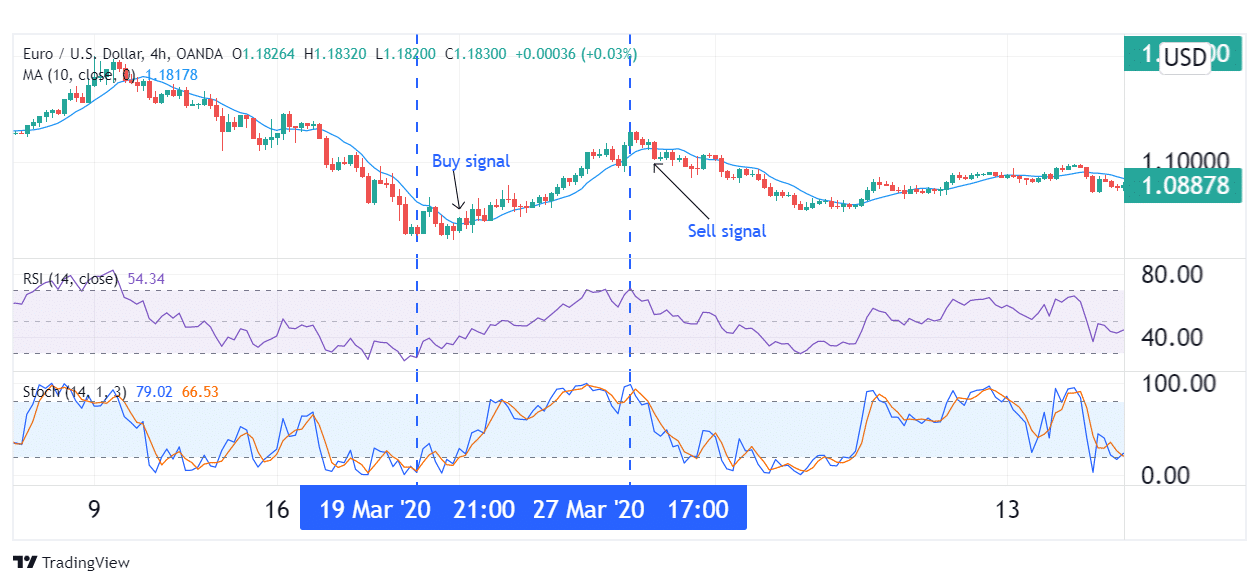
From the above example, we can see that on 19th March 2020, both the RSI and the stochastic indicators signaled that the EUR/USD pair was oversold. This forecasted an incoming uptrend. A few hours later, price crossed above the 10-period MA, giving our buy signal.
This bullish trend carried on until the 27th of March, when both oscillators signaled that the pair may be overbought. A few hours later, the price crossed below the MA line, giving us our sell signal. For this strategy, it is prudent to put your stop loss a few pips below the resistance level at the bullish reversal point.
Conclusion
The RSI is a useful indicator in predicting reversals and trend continuations. However, its efficiency is greatly improved when combined with other indicators such as stochastic oscillator and Moving Averages. These combinations yield the best RSI strategies for forex trading.