There is a myriad of tools that traders utilize every day in their technical analysis endeavors. These formations are better pointed out by drawing lines on charts to accentuate them. When a setup involves two trendlines that are not parallel and, when extended, will intersect at some point, it is called a triangle.
Now, these triangles can take two forms. The first one involves a horizontal resistance, with diagonal support trending upwards. The second involves horizontal support, with a diagonal resistance slanted in a negative slope. The point where these two trendlines meet is referred to as the apex. The vertical distance between the beginning of these trendlines is the base.
Ascending triangles
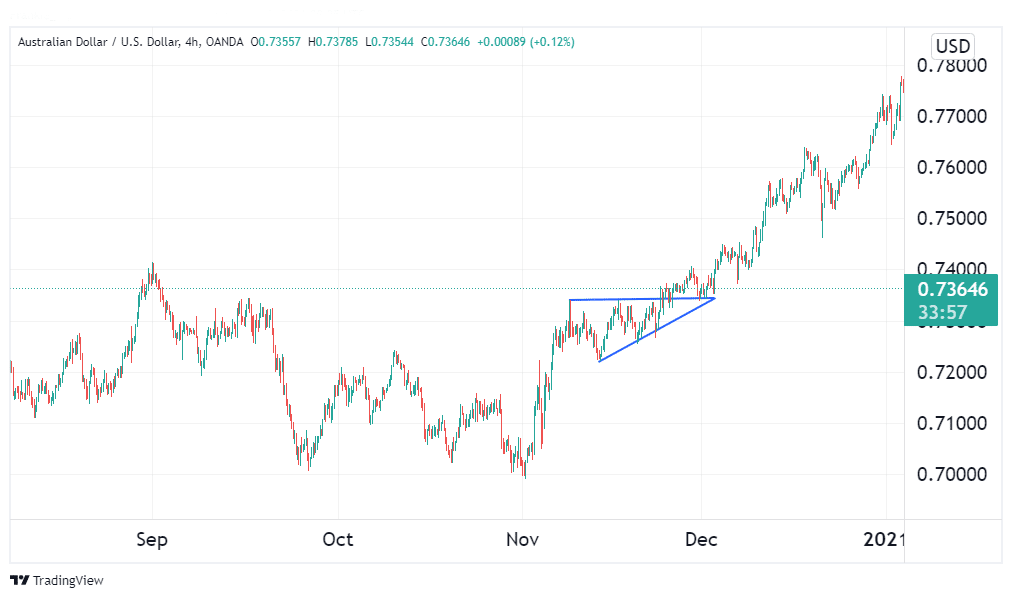
When prices observe a horizontal resistance while forming higher lows, they create an ascending triangle. This is to mean prices are not making any higher swing highs, but their swing lows are increasingly reducing in height. The resistance, on the other hand, tends to hold out until a breakout happens.
The interpretation behind this setup is that buyers are increasingly gaining momentum. This can be seen in the decreasing height of the swing lows. However, sellers are still strong enough to push the buyers back whenever they try to break the upper resistance. However, seller momentum is slowly diminishing, as evidenced by the decreasing height of the swing lows.
Eventually, buyers overwhelm the bears, which manifests as a break past the resistance line. In a majority of the cases, breakouts will happen in the direction of the preceding trend, which means an upward resolution for these triangles. Sometimes, the resistance line holds, discouraging the bulls and giving bears the upper hand.

The example above shows the setup that resolved to the upside. Notice how prices retested 0.73646 in late November 2020, which turned into support before resuming the rally.
How to trade the ascending triangles?
The triangles will almost always culminate in an upward breakthrough. This isn’t always the case, though. As a result, if you want to trade an ascending triangle, you should wait for the breakout before entering any trades.
If you want to go long, buy at the candle’s close above the setup’s upper border. The ideal profit target should be at a distance equal to the base of the triangle from the entry point. However, if the first candlestick closes significantly above the resistance in case of an upward breakout or below the support for the opposite, it may be a tad late to enter the trade. This is because there’s a reduced potential for profit from the trade.
Another common occurrence in this pattern is false breakouts. To protect yourself from loss in the event of one of these, you need to employ a stop loss. If the breakout you’re trading was upwards, the stop loss should be placed just below the broken resistance level. If the market broke out to the downside, the ideal protective stop would be above the broken support.
Descending triangles
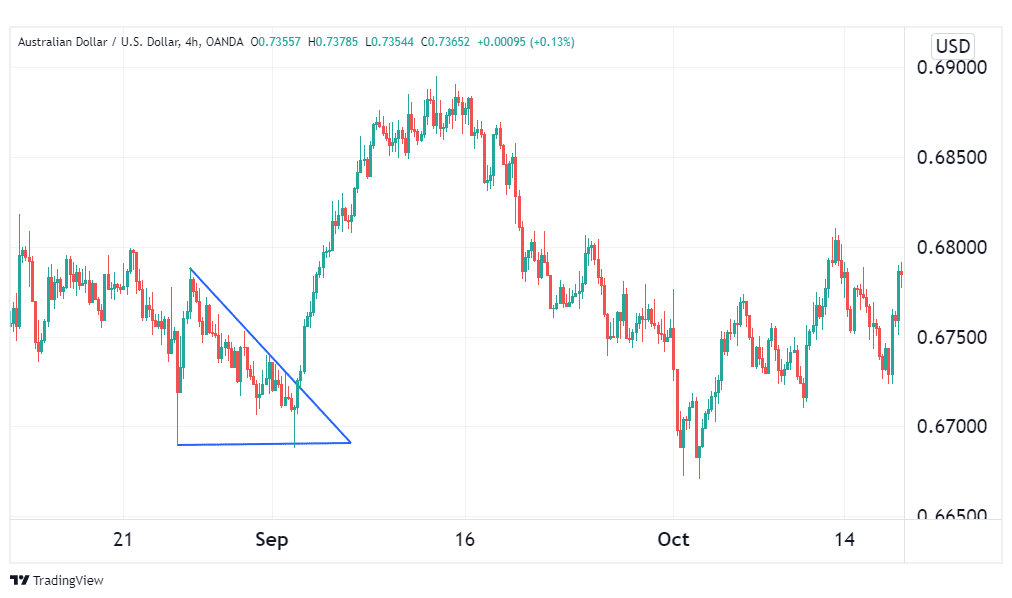
The setup forms when prices test a horizontal line of support, as well as a diagonal resistance level that slopes downwards. This means that these prices continually form lower swing highs, while their swing lows remain unchanged in height for the most part. This continues until a breakout from support is staged.
The interpretation behind this price action is that bears are increasingly gaining momentum. This is evidenced by the lowering swing highs, which means bears are succeeding in pulling the pair’s price down. Bulls, on the other hand, are losing momentum, but they are still managing to keep bears from breaking past the support level. With each attempt the bears make to break this level, the support by bulls grows weaker and weaker until finally, this level is broken.

Statistically, a downward breakout is the most likely outcome of this chart pattern. However, sometimes this triangle will culminate in a bullish breakout. This means that bulls successfully gave the impression that the support was too strong, hence discouraging the bears.
Descending pattern tactics
The principle behind trading these triangles is the same as that used for their ascending counterparts. First and foremost, if you intend to trade this pattern, you should always wait for the breakout. However, if the pattern happens in the asset where you’re holding, do not be in a rush to close your position. Wait for it to run its course and only exit when you’re sure the breakout is against your position.
After identifying the direction of the breakout, enter when the bar closes below the setup’s down boundary. This will be the entry point for your trade. In the case of a breakout to the upside, measure the length of the base of the triangle and use this distance measured upwards from the entry point as your profit target. Similarly, for a downward breakout, use this distance measured downward from your entry as your profit target.
Similar to its ascending counterpart, stop-losses should always be used to prevent losses in the case of a false breakout. Depending on the direction of the breakout, the stop loss may be placed just below the support or just above the resistance line.
Conclusion
The setup manifests when trendlines joining a formation intersect on one end. The ascending variation forms by higher lows and static highs. Conversely, the descending structure has lower highs with unchanging lows. Statistically, most ascending triangles will culminate, breaking out to the upside, while the descending ones will stage a downward breakout.