Fibonacci Retracement is an accurate tool. It is based on patterns and sequences that were originally designed for mathematical calculation.
What is Fibonacci Retracement
Fibonacci Retracement serves us to assess the depth of correction. This tool is really very accurate in determining pivot areas, but it is very important that it be properly built. Most using levels build them illiterate, as a result of which accuracy suffers. I will give two pictures in which I will depict the correct and not the correct way to build levels, and you yourself try to guess why in the second case the levels are built correctly.
History of Fibonacci Retracement
The Fibonacci level method is based on the works of the Italian mathematician Leonardo Fibonacci (1170-1250), who described a sequence in which each subsequent number was equal to the sum of the previous two. This sequence was called the Fibonacci sequence: 0, 1, 1, 2, 3, 5, 8, 13, 21, 34, 55, 89, 144, 233, 377, etc.
The first two numbers of this sequence are either 1 and 1, or 0 and 1, and after 5, each subsequent number will be approximately 1.618 of the previous one, and each previous number will be approximately 0.618 of the current.
Traders noticed that quite often corrections from current trends have the values of the described sequence, which, in turn, are represented by the percentage of the price movement equal to 23.6%, 38.2%, 50.0%, 61.8% and 76.4%. The trend movement itself is taken equal to the interval from its beginning – the lowest point (0%) for the ascending and highest point (100%) for the descending movements, and until its current completion – the highest point (100%) for the ascending and lowest point (0%) for downward movements.
Moreover, the members of this percentage sequence are symmetric with respect to the value of 50, since 38.2 are as far from 50 as 61.8, the same for the values of 23.6 and 76.4.
How Fibonacci Retracement can be adjusted, and how is it useful for traders
In order to add this tool, just go to a trading terminal like MetaTrader4 or in the technical analysis window of your broker’s platform. Here you need to open the tab with tools and indicators to select Fibonacci Retracement.
The next step for applying Fibonacci levels to an uptrend is to combine the values of the minimum and maximum price values (its price extremums), stretching the line between them, from which the indicated levels will be counted. To plot Fibonacci levels on a downtrend, you should combine its maximum price value with the minimum (price extremums of the trend) using a line.
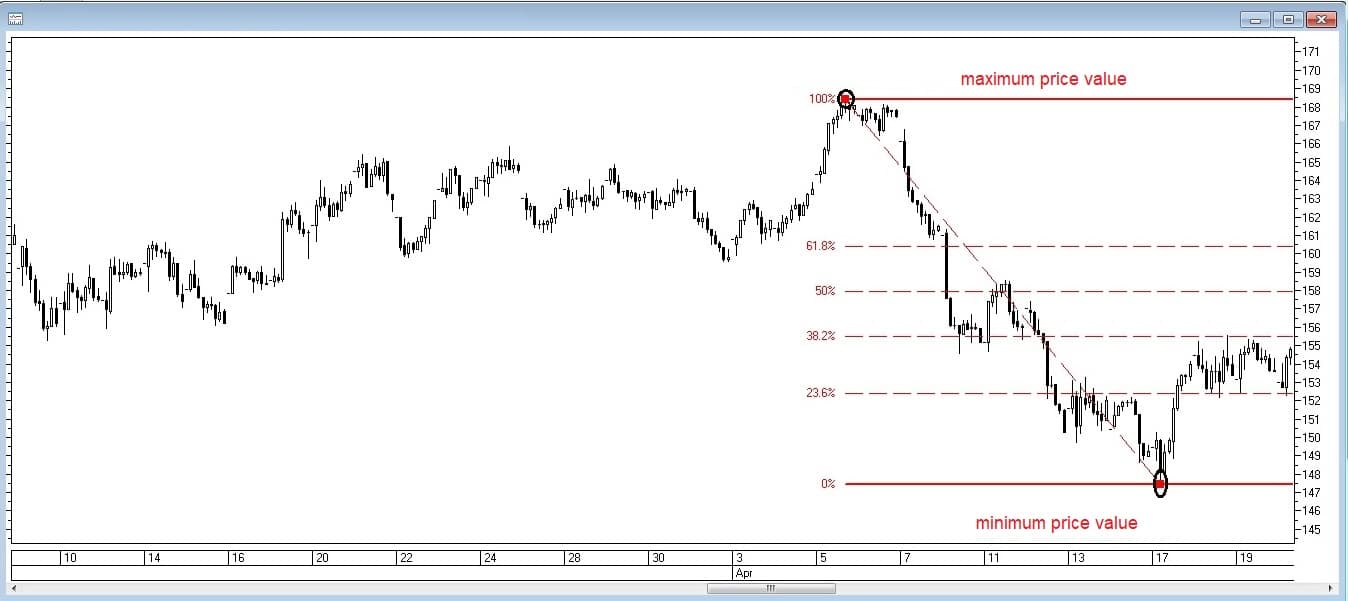
It is believed that the deeper the correction, the lower the potential for the subsequent movement, since with the development of a deep correction (over 50%) for an uptrend, the desire of the participants to sell is very large, which can complicate further price increases, and with a rebound for a downtrend over 50 % the desire of participants to buy is also very large, which creates an obstacle to further price reduction.
Conversely, with correction levels of up to 38.2%, the development of further price movement in the direction of the dominant trend is most likely, since the strengths of the opponents of the movement are small.
Basic strategies, using Fibonacci Retracement
A tool such as Fibonacci levels allows the trader to determine the most probable moments of the completion of the pullback from the current dominant trend, as well as to determine the presence of the trend as such (it is believed that when the breakdown level of 61.8%, the trend is probably broken).
If the price in the course of the development of the correctional movement against the dominant uptrend reaches the Fibonacci Retracement (the so-called Fibonacci retracement levels) and bounces away from it, then a purchase is made, and a stop order for sale is placed with some indentation from the price reversal point.
If the price breaks through this indicator without giving a rebound, then it is ignored. In our example, the price bounced up from the Fibonacci level of 38.2% (and broke through without giving a rebound, the level of 23.6%), which was the basis for opening a long position.
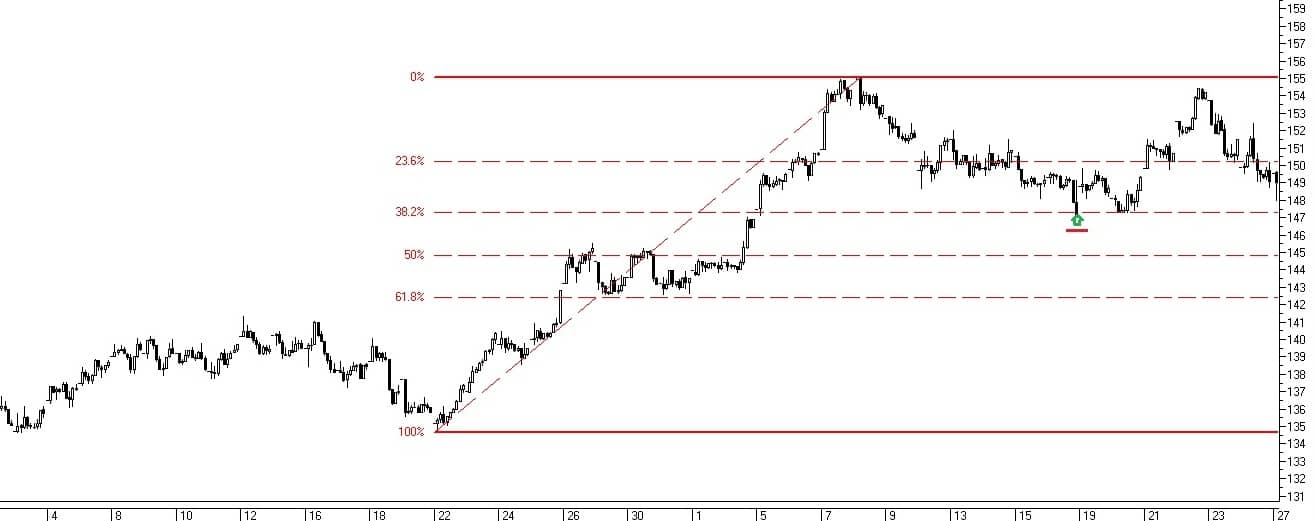
Here’s a buy at a price rebound from the Fibonacci level. If, during the development of the correctional movement against the dominant downtrend, the price reaches the retracement level and bounces down from it, then a sale is made and a protective stop is placed behind the current price maximum located at the retracement level.
If the price breaks through the retracement level without making a rebound, then it is ignored. In this example, the price during the correction to the downtrend broke through the levels of 23.6% and 38.2%, but rebounded from the level of 50% down, which served as the basis for the sale.
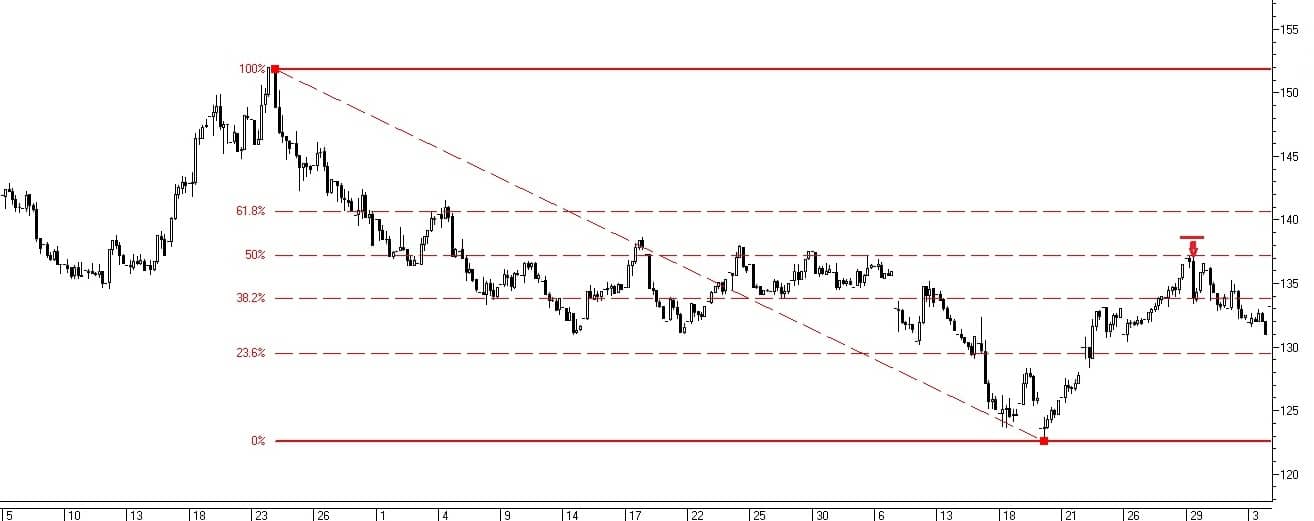
This is an example of making a sale at a price rebound from the Fibonacci level. Bright representatives of the family of difficult correction currencies are GBP/USD and GBP/JPY. As a rule, before reaching the key level for these pairs of 61.8%, they go a long way, which can be called the “ladder”. Conventionally, we can designate it as 38-50-62. The image below shows how the pound often comes in corrections.
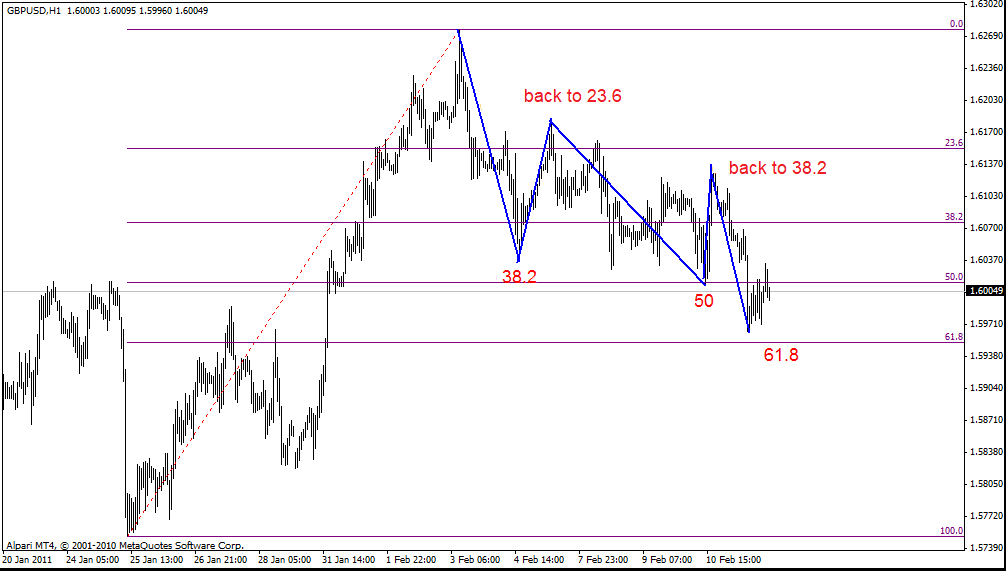
Such ladders are in the trade, because all that is needed for a profitable result is to place pending orders from the levels. Look, after reaching a level, the price usually breaks through it and goes into a drawdown. This is bad, and in this case it is necessary to clarify the construction of Fibonacci. Let’s see if we get a ladder, with the correct construction of levels.
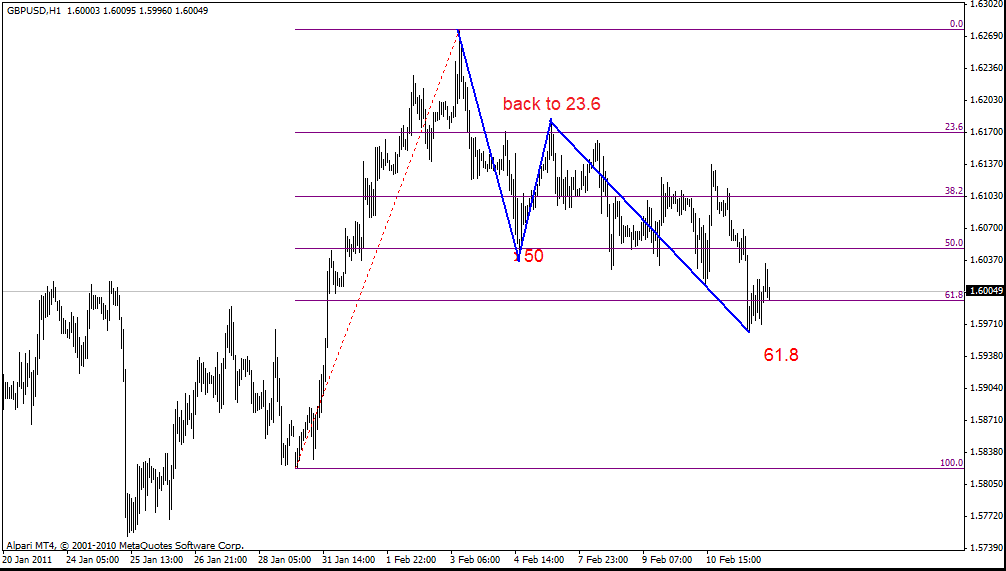
Both of these construction methods are correct. In the first case, the correction consists of 5 waves, and in the second – of three. These are the two most common patterns on the above tools. Most often, five-wave correction (this is not a wave analysis, just a similar designation) is peculiar to the pound and crosses with it, while three-wave correction most often occurs on the euro, yen and Canadian dollar.
Final words
Fibonacci levels help the trader to determine the moment of completion of the corrective movement to the main trend, as well as assess its further potential. Naturally, in modern reality, the Fibonacci retracements are not used as an independent method, but in addition to other market research methods, both technical and fundamental.
The combination of the diagonal line of the Forex trend and the support and resistance levels are used by many traders, because there is a high probability that these levels are not only visible to you. Nevertheless, one should not forget that both the trend lines and the Fibonacci retracement strategy are quite subjective methods of analysis. Different traders, of course, draw them in different ways, but of which you can be completely sure that there is a trend in the market!