Forex traders strive every day to predict price trends of various pairs, all in a bid to profit from these moves. To that end, several tools and instruments have been developed to aid in this venture. The Rate of Change (ROC) is one such tool that keeps posting impressive results when it comes to identifying trends and highlighting early entry points and exits.
Defining the ROC
The Rate of Change is an oscillator that highlights how much prices have changed over a specified period. It does this by comparing the current price with the closing price a specified number of periods ago. The difference is displayed on a line chart that oscillates above and below a zero line.
How it’s calculated
We have established that this oscillator takes a currency pair’s current price and compares it to the closing price n periods ago. Representing this in an equation:
ROC = ((current close – close n periods ago)/ close n periods ago)) * 100.
Therefore, if the current candlestick closes at the same price as the candlestick n periods ago, the resulting ROC will be zero. If the result of this equation is positive, then prices are rising, and the oscillator will trend above zero. Conversely, if the market is in a downtrend, the oscillator crosses below the zero line into negative territory.
If this oscillator is in the negative zone but has an upward trajectory, this could be a sign that a downtrend is losing momentum. Similarly, if the oscillator is in the positive region, but it is on a decline, it could signify waning bullish pressure.
How ROC works
The methods of obtaining signals from this indicator do not differ much from those of most other oscillators. For instance, like the rather popular RSI, you can use ROC to identify overbought and oversold regions. Alternatively, you could use it to time entries into a prevailing trend by waiting until it crosses the zero line. You could also identify any divergences between itself and the price chart. Let’s take a look at each of these signal generation methods.
1. Timing entries into a trend
It is a common practice for forex traders to trade in tandem with long, sustained trends. However, when a trend is already in motion, the question then becomes; when is the appropriate time to enter a trade in its direction, be it a short or long trade? The ROC comes in handy at times like these.
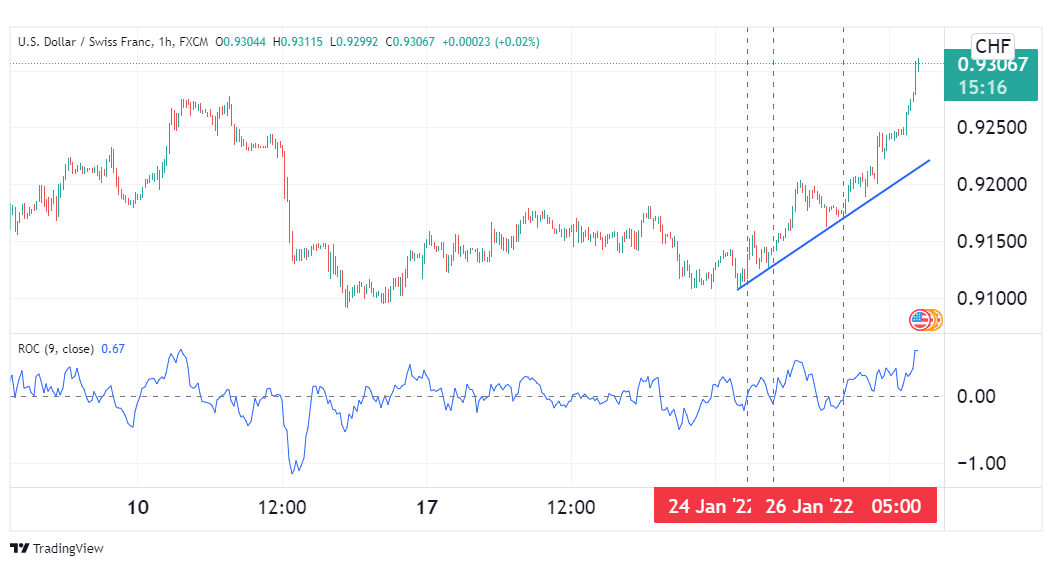
The chart below shows a USDCHF hourly chart, showing the pair in a current sustained rally. Such a move would necessitate the entry of long trades, as the pair seems to have strong bullish momentum behind it.

To time ideal entries into this trend, we shall need one of the ROC’s signature signals – the zero line cross. Usually, long trends are marked by periodic price pullbacks, which will be reversed once they hit a support level more often than not. We shall be using our indicator to time the moment these price pullbacks are reversed.
These instances can be identified by the ROC oscillating into the negative zone, then reverting back to cross above the zero line. From the chart, we see that the first major pullback was reversed on January 24th, the second on the 25th, while the third and largest was reversed on the 26th, as highlighted by the dotted lines. All of these were opportune entries for a long trade. A suitable stop loss would be just below the support level, while the profit target would be determined by a suitable risk to reward ratio.
2. Identifying oversold and overbought regions
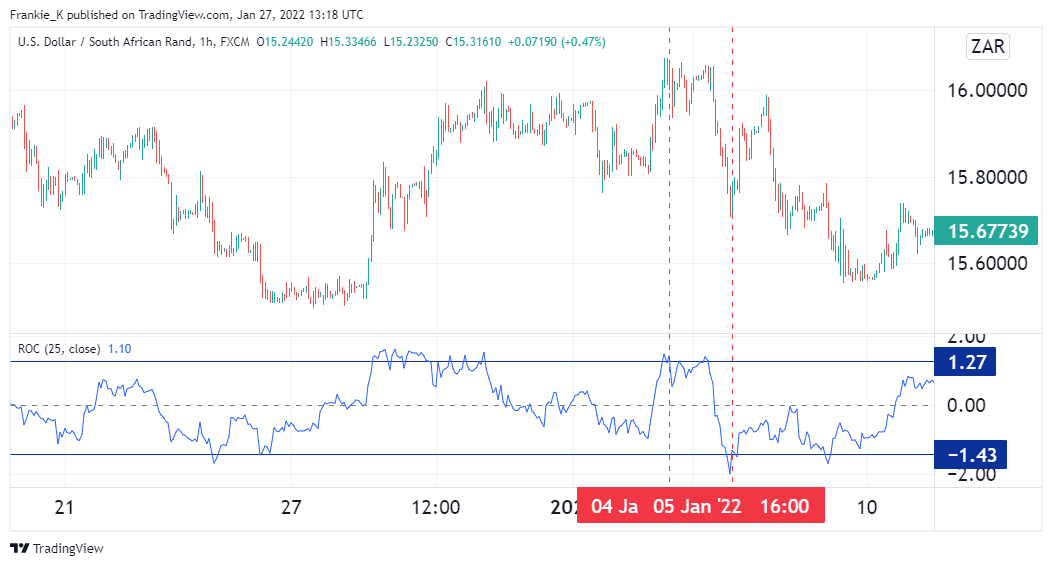
Some analysts argue that the best settings to use the ROC with are a 25-period for swing trading and a 12-period for much shorter trades. Applying the former, we expect that an extreme reading of the ROC in the positive region would serve as an indication that the pair might be overbought. Similarly, a lower than usual reading in the negative zone would point to an oversold market.

The chart above shows the hourly chart for the USDZAR pair. The estimated overbought and oversold regions are highlighted by the blue horizontal lines on the indicator window. On January 4th, the pair was overbought after having rallied steadily for a few hours. True to this signal, the uptrend waned, starting off as consolidation at first before plummeting to negate the gains of the prior rally.
On January 5th, the ROC showed that the pair was oversold. True to this signal, the downtrend that had prevailed ended, and prices were just as soon rallying again. However, these types of signals are not always accurate, as an oversold pair may keep declining, or a seemingly overbought pair may keep rallying.
3. Divergences
Like most oscillators, whenever the ROC and the price chart do not move in step, this may point to a reversal in the works. If prices trend upwards while the ROC displays a decline, a bearish reversal may be lurking. Similarly, if the ROC rallies while a pair’s price plummets, then there may be hope for the bulls in the near future.
Conclusion
The ROC is an oscillator that is used to identify trends by comparing two prices n periods apart. With this tool, you can obtain trade signals by identifying crosses past its zero line, divergences, or looking out for oversold and overbought regions. However, like most oscillators, this indicator is not always sufficient as a stand-alone instrument. For best results, one would be wise to pair it with other complementary indicators.