Many traders use a clean chart that is devoid of any hints. They believe that this is the most correct and classic way of analyzing price movements. But trading with indicator is much easier, especially if you are a new guy on the Forex market. There are many indicators that help to avoid false trends and concentrate on market entry spot.
Thus, technical analysis is an important component of any trading strategy. It’s hard to achieve goals without it. Indicators can be distinguished into a separate group – these are price charts to perform complex calculations, process data and generate signals for certain actions on the international currency market.
Traders use it because software algorithms are more accurate. Long-term chart analysis is tedious even for professional traders. Sit in front of the trading terminal for several hours in tension, and you are guaranteed to miss some price movements. Indicators help reduce the percentage of false entries into the market and allow traders to increase their overall profit.
Types of indicators
To better understand the Forex market, you need to find out what types of such tools exist at the moment. It is best to divide them into three categories.
So here they are:
- Trend indicators;
- Oscillators;
- Psychological indicators.
Trend tools are very popular among many traders because they allow you to determine where the price is moving with a high degree of probability. Such tools can also signal a new trend, which is very important for beginners, unfortunately they have one drawback, and it is a delay. It will not show you instant changes in the chart, especially if you use 15-20 minutes time frames.
Oscillators are the second auxiliary tool that enters the arena when trend indicators do not work for some reason. They also help determine the direction of price movement in its narrowest corridor. The main advantages of oscillators is that they are more dynamic and do not have such a large delay as indicators. Sometimes, these trading tools help to predict the price movement and, as it were, get ahead of themselves. A competent trader will have to learn to analyze these signals in order to get more benefits.
Psychological indicators can show the mood of the crowd and take into account various political economic events. A lot of psychological factors can affect the market and change the price. Of course, this type of tool is not as accurate as the first two, but it cannot be discounted. This also affects the overall strategy. It is important for understanding how the Forex market works.
Using all these types of tools and trading tools is very important for a trader since he or she can create a working strategy based not only on experience, but also on terminal tools.
Main Specifications
Forex trend is the direction of prices on the market. A strong trend movement can be profitable as it shows the direction where the price goes. But it has one drawback. Any trend can show false signals in case of the price correction, and indicators may not help to find the correct spot to buy or sell.
Trend indicators are also divided into 3 types:
- Upward indicators contain upward price movements;
- Downward indicators contain lowering price movements;
- Lateral indicators arise only in the case when neither the seller nor the buyer has an advantage.
Oscillators are the second type of tools that characterizes the state of overbought or oversold of the market. Unlike trend indicators, oscillators work just fine in corrections. And the phases of the market, and explosions of volatility – all this will perfectly reflect the oscillators.
But with the start of the trend, they will begin to show false signals, unfortunately, and they have flaws. Therefore, a trader should take into account that at work it is necessary to use at least two indicators, given their weaknesses and strengths.
Volume indicators can track price changes in a certain period of time, which allows you to calculate a favorable moment to enter the market. Cluster indicators are the latest generation indicators. They track various tools and visualize market events.
Custom indicators created taking into account those parameters of the trader that he would like to see. There are approximately thousands of such tools. Indeed, each trader can configure the indicator parameters for himself and use it with convenience for personal use.
Top 5 indicators for Forex trading
Moving average
The moving average is only first of all, many use it for currency pairs and stocks. The fact is that this type of tools allows you to reduce the market noise level to find an acceptable point to enter the market. Also this indicator helps to know the direction and trend lines. In general, you can focus on the levels of support and resistance and use this indicator to trade in the short and medium term.
It is based on a certain time period of historical quotes. It may be 14 days before the start of trading. It calculates the arithmetic mean value of the past price fluctuations eliminates the total noise; the calculation is carried out at closing prices and maximum and minimum transactions. It is worth noting that it works with volatility in the market and may give some errors with lateral price movement. In this case, it is necessary to add additional elements to increase the accuracy of price forecasting.
Here is a great example of the Bullish signal:
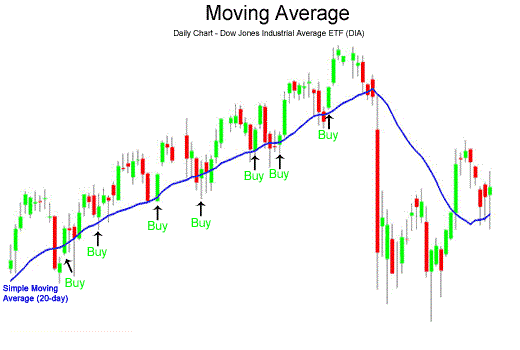
Here we can see the established uptrend. The stock price falls below Moving Average. Traders should buy when price closes above Moving average.
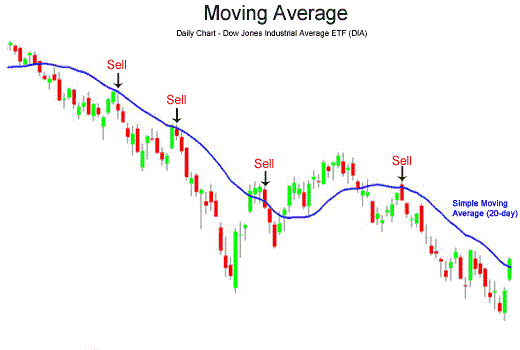
This example can show the Bearish signal. It’s an established downtrend. The stock price falls above Moving Average. Sell when price closes below the line. Of course, these examples are only basic for using this indicator. You can also combine it with other trading instruments and an oscillator in order to increase profitability.
Related article: Moving Averages Explained
Relative strength index (RSI)
This indicator helps to form the limits of support and resistance above or below which the current price cannot fall. They show the strength of the correction and the trend is worth noting that this indicator covers various periods and takes into account the closing prices of previous trading days.
The indicator is simple and helps make trading more systematic. At the moment there are a large number of strategies but the rules do not change much. Purchase is made when the line of the level indicator 30 crosses from the bottom up. A signal to close the Long is the intersection of line 70 from top to bottom point. This immediately opens a sell position. Thus, according to this strategy, the trader always has an open position in the market, buy at the exit from the oversold zone and sell at the exit from the overbought zone.
As a result, the strategy does not give a competitive advantage. This indicator can be used in combination with other options for working in the trending market. It is best to conduct experiments in advance and test the developed strategy before directly trading on a live account.proper setup or in conjunction with supporting trading instruments.
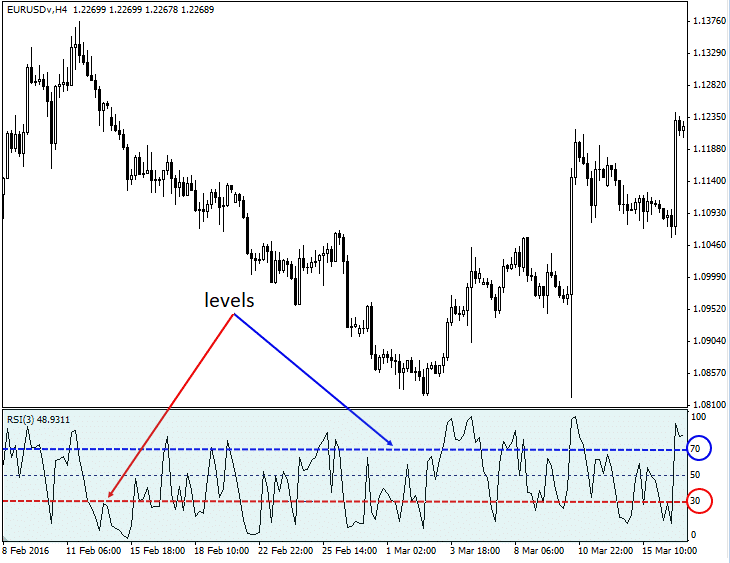
You need to sell if the curve lies above the 70% mark and crosses from top to bottom. Buying occurs if the curve lies below the 30% mark and crosses the level from bottom to top.
One of the main problems for beginners is the incorrect setting of parameters. It is worth understanding that each has its own nuances and the number of signals. Unfortunately, their quality can be significantly lower. It is necessary to supplement this indicator with additional sources of information so as not to be mistaken. Control fluctuations you will get fewer points for entry but you can more accurately predict the movement of prices. Experienced traders recommend using this indicator on medium time frames in order to practice. It’s best to pick one or two additional oscillators to adjust the price movement and to insure against possible surprises.
Related Article: RSI Explained
Stochastic
This is a technical indicator. It measures the rate of change in price if you visualize the movement of a price. You will notice that it begins to slow down much earlier than the fall. The momentum always changes before the price itself. Thus, using stochastic, we can determine the likely pivot points.
There are several values for the indicator period and timeframe that will work with each pair. Some prefer large periods (21.9.9). While others, on the contrary, use the standard for MT4 (5.3.3). Some prefer to trade on the daily chart, while others prefer the H1 chart.
The choice involves a balance between the sensitivity and reliability of the signals. As a rule, the smaller the stochastic parameters or time frames, the faster they will respond to market changes, and the more signals there will be. The disadvantage is that these signals may be less reliable. On the contrary, the larger the stochastic parameters or the longer the time interval, the less signals there will be. However, their reliability is increasing. Everyone should test different values to understand what suits you best.
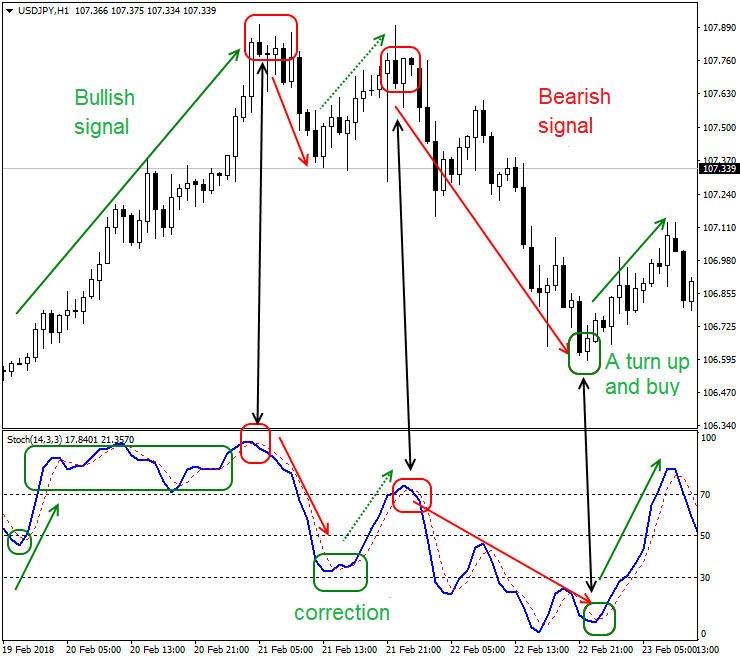
The disadvantage of this approach is that after the exit signal, the market can continue the trend movement. Therefore, you can use a couple more filters:
Trend Filter: do not make transactions in zones above 80 and below 20, only when leaving the zones. In a trend, the market may for a long time be in overbought / oversold zones. It is risky to make transactions within the zones, it is more optimal to enter after leaving the zone.
Trend / flat: if the market is trending, it is recommended to trade only in the direction of the trend. If the market is in flat, you can trade in both directions and work from the zones is most preferable.
It is best to consider historical quotes and many examples of correct trading. Only after that you can correctly analyze the market and find entry points for opening shorts or longs. It is also necessary to adjust the indicator value with additional settings and tools. In this case, you can avoid the risks and get more accurate indicators.
This trading tool is often found in most terminals for trading and is an additional element of the strategy for deciding whether to buy or sell. The indicator has been on the market for more than 70 years and has established itself as one of the common options for reliable trading. The point is to understand that many strategies based on this indicator, designed to open a deal against the trend, the indicator can naturally work during horizontal price movements without strong volatility. It helps to catch entry points, and it responds well to price impulses. If you analyze the indicator correctly, you can achieve good profitability.
Related Article: Stochastic Oscillator Explained
Fibonacci retracement
The Fibonacci indicator is a fairly popular instrument, thanks to which traders are able to determine with a high probability the levels at which price correction takes place, which can be successfully used in trading. The instrument independently performs constructions based on Fibonacci numbers, which are the basis for analysis.
The basis of the plant is a trend and waves of correction. The trend is the basis of analysis, it is on it that levels are built. The principle of operation is simple: the wave of the trend rises to a certain height (taken per unit), which is divided in certain proportions into parts using the specified ratios (0.236, 0.382 and others). Each number is marked at a certain level of the wave and indicates the place where the most significant change in price is most likely to occur.
Any Fibonacci indicator similarly draws lines on the trend graphs, which reflect the proportional dependence of the numbers. Thus, for price correction lines use the numbers 0.236, 0.382, 0.5, 0.618, etc., which can be set in the form of figures or percentages (23.6%, 38.2%, 50%, etc.) automatically, it is simple enough to prescribe them in the settings.
Like many other means of technical analysis, the Fibonacci indicator is not a universal “recipe” for successful trading – it is often used in one or another advisor working on its signal and the values of other indicators can be successfully combined with various strategists. The instrument does not give signals, it requires the obligatory participation of the trader and the analysis of readings on the chart.
Thanks to this indicator, the trader receives very important information about the movement of value in the market: price correction points after the trend, possible price targets and continuation of the trend, the strongest levels of support and resistance. The analysis on a grid in the course of intraday trading (on TF M5, M15) well shows, works on hourly intervals, not daily and weekly schedules of the analyzes to carry out more difficult.
Trading rules:
- Installation of the Fibonacci grid according to the already formed trend, finding the optimal points.
- Determination of adjustment levels.
- Opening an order with a profit of 38.2%, a stop loss outside of 0%.
- After passing the price of a sufficient distance to record profits.
Experienced masters advise to take into account all the levels of resistance / support, which are on a certain section of the graph, paying special attention to those that form clusters (located at a close distance from each other – as far as possible against them).
The figure of the four-hour chart of the EURUSD currency pair clearly shows how this tool accurately determined the corrective price reversals relative to the main trend movement. In this example, it can be seen that the resistance levels were: 61.8%, 38.2% and 23.6%. Support turned out to be the zero level.
If the trend has changed direction, turning from a “bearish” to a “bullish” one, then the Fibonacci lines should be stretched towards its upward movement until the nearest correction:
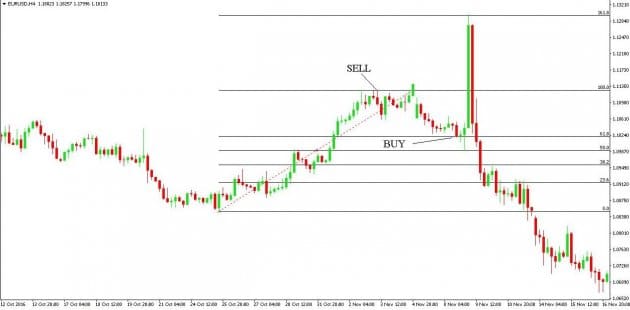
The graph shows that this tool worked correctly, almost accurately, identifying important levels. The last of them 161.8% was very accurately predicted. The rapid final “bullish” breakthrough stopped precisely on this line. Analyzing the situation on the market, you can open a sell order by placing a safety Stop Loss 250-300 pips above the level of 100%.
This trading tool is very interesting for both beginners and professionals. You need to pre-train to interpret all the indicators for buying or selling on Forex. The fact is that Fibonacci retracement is a specific indicator that is designed for trained traders. You need to read more information and practice on demo accounts before finding the best strategy for yourself with setting the right values.
Any indicator or the oscillator does not guarantee you one hundred percent entry into the market and make money. You need to learn to understand how the price behaves and take into account all possible risks. The Fibonacci indicator allows the probability it is necessary to choose the most effective values in order to see more high-quality signals on the terminal.
Related Article: Fibonacci Retracement Explained
Bollinger bands
Bollinger bands are indicators used in stock trading using the technical analysis approach. Technical analysis is an approach to market investment that attempts to use a disciplined market timing approach. Bollinger Bands were developed by John Bollinger in the 1980s.
Technical analysis approaches include the calculation of moving averages of the Forex. A moving average is simply an average that is calculated over a period of time and repeated over time. A typical MA is the twenty-day moving average, which is calculated as the sum of the share price for the last twenty trading days and the result is divided by twenty. A day later, the average is recalculated, but the price decreases from day one and day two becomes day one price. This is repeated every day until the original price of the twentieth day is replaced. This process is repeated every trading session and the results can be plotted as average stock price versus time.
Using the same data set from which the average is calculated, a standard series of deviations can be calculated for the same data set. Two more lines are plotted on the graph, the first showing the mean plus one standard deviation and the second showing the average minus one standard deviation. These two lines are called Bollinger’s bands. The mean plus one standard deviation is the upper Bollinger band and the mean minus one standard deviation is the lower Bollinger band. There are now four lines in the chart: the daily stock price, the moving average, and the upper and lower Bollinger bands.
Technical traders use this information to determine trading signals. If stock prices approach the upper Bollinger bands, stocks are assumed to be in their high price range. If the stocks approach lower Bollinger bands, then they are said to be in their lower trading band. Should the stock price break outside one of the Bollinger bands, a significant shift in the share price is expected. John Bollinger, who came up with the Bollinger Bands concept, is now a financial commentator at CNBC and maintains a website on the Internet with much more information about his theories and concepts regarding Bollinger bands.
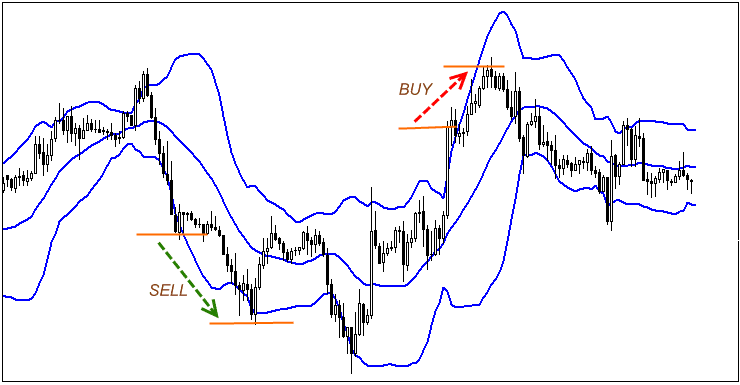
Trading with this indicator is very simple. Traders can see the price channel. As soon as there is a price breakthrough outside the line, the trader needs to open a position to buy or sell. It is also necessary to focus on the schedule. It is very important to pay attention to the price action.
This indicator is very common in the strategies of well-known traders who trade in the medium term. The fact is that you need to define a clear line between a large number of signals and the accuracy of entry into the market. This is the cornerstone of any strategy that should be based on several indicators and trend confirmation systems. The fact is that trading with large amounts requires maximum accuracy and accuracy. That is why it is impossible to use the volatile market on small time frames. it is tantamount to adventurism.
Related Article: Bollinger Bands Explained
The Conclusion
It should be understood that indicators are not a panacea but an assistant for daily trading. Indicators help to consider trends and price movements on historical quotes. This allows you to more accurately monitor the movement of the trend, notice various figures and enter the market at the right spot
Knowing the principles of various indicators, you can create your own Strategy and get profitable results. Nevertheless, it is necessary to study each trading option in detail so that the indicator brings profit. With this principle of trading, you can create your own strategy and implement various ideas in the financial market.
The final choice of indicators depends only on the novice trader. It is necessary to take advantage of the broker’s demo flights and test all Strategies in combination with various indicators, and oscillators with support and resistance lines. Only after thorough testing and understanding of all indicators is it worth starting trading systems.
It is also necessary to analyze historical price quotes in order to understand how the market behaves in certain situations. Do not forget that indicators can become practically useless if there is economic news that differs significantly from the stated forecasts. It can significantly affect the indicators and produce a surge in volatility. Use several trading tools at once to cut off false entry points to the market.