If you are an investor interested in any currency pair during NYSE trading hours, the USDCAD should be among your priorities.
Ranked among the top 5 most traded currency pairs on the platforms, the USDCAD represents a significant volume in Forex trading. Such a pair offers excellent profitability possibilities because the daily trading volume is considerably high.
Learning about the technical and fundamental aspects that make this currency pair move price is a must for successful trading. Therefore, we have compiled the essential information related to the USDCAD. Once you acquire the knowledge, you will put it into practice and profit from it as soon as possible.
Fundamental aspects
Like other pairs in the FOREX market, the USDCAD is firmly anchored to international commodity prices, especially oil.
Canada and the United States are among the countries with the highest oil production levels in the world.
In addition, Canada’s leading oil export destination is the United States. Therefore, a rise in oil prices will hurt the US dollar and positively affect the Canadian dollar. Conversely, if oil prices fall, the pair will tend to rise.
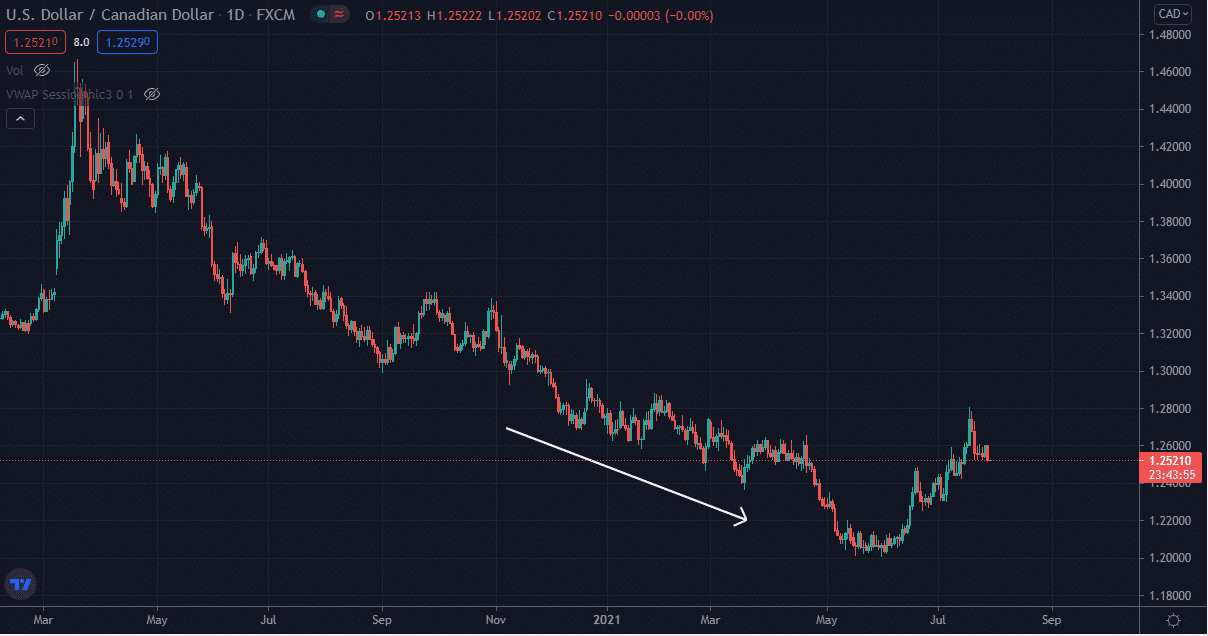
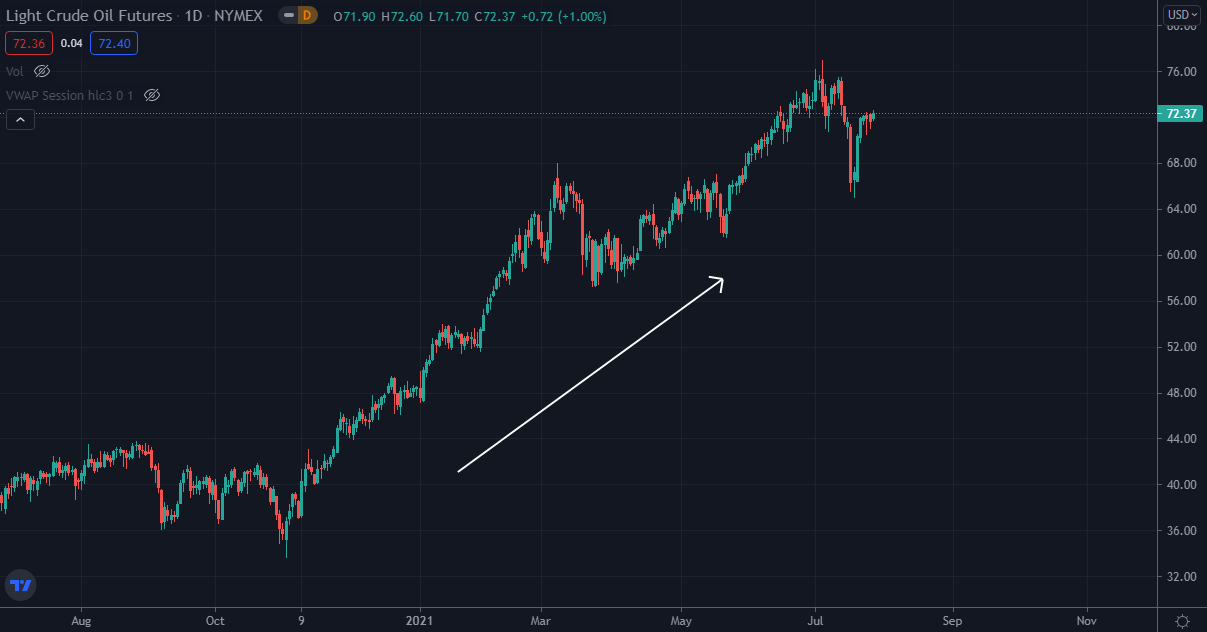
Canada is also a significant exporter of materials and commodities, such as wood, grain, and minerals. Being so close to the US has strengthened the import/export industry in Canada. In addition, it helps the currency maintain a stronghold in the foreign exchange market.
Changes in interest rates and policies to help increase the employment rate are other aspects to take into account. The announcements are made by the Central Bank of Canada and the Federal Reserve of the United States.
Changes in interest rates and policies targeting the increase in the employment rate are other aspects to consider. These announcements are made by the Central Bank of Canada and the Federal Reserve of the United States. The essential thing in this aspect is to be attentive to the dates when they will meet because, during those days, the volatility of the USDCAD pair increases considerably.
Because they are firmly related economies, data on economic growth (GDP), industrial production (PMI index), and consumer demand for goods are highly relevant. As a result, it can cause significant volatility spikes in the pair.
Profiting from the wrong policy decisions of some countries is possible. One of the examples is the fall of the US stock market and real estate market in 2008. In addition, the banks’ recklessness in lending non-stop throughout the 2000s resulted in a crash. However, Canadian banks were spared because they did not follow the same policies as American banks.
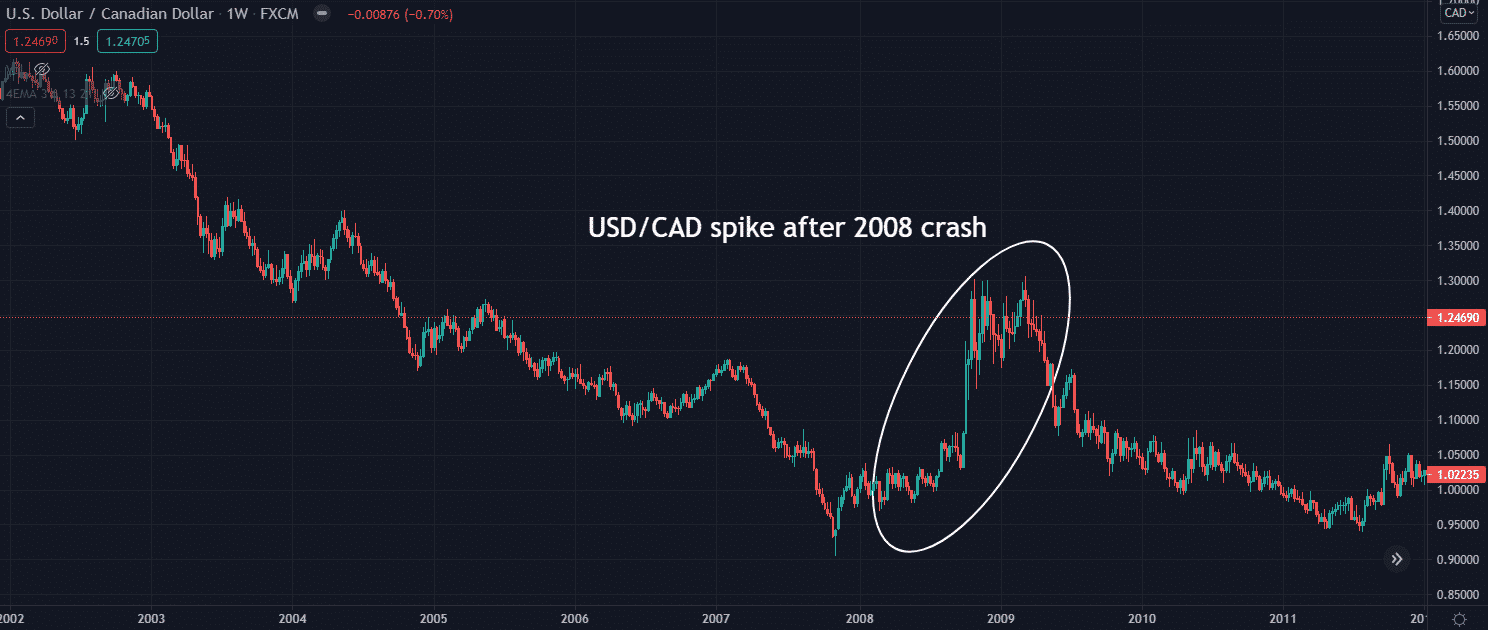
Since 2005 the USD/CAD was in a downtrend, which meant that the Canadian dollar was becoming more and more valuable against the US dollar. Once the crash happened in 2008, the CAD was more affected.
Technical aspects
Different strategies can be applied based on technical analysis since it is a very liquid pair, especially during the hours of higher volume.
What’s the best time to trade USDCAD?
One of the best times to trade this pair is during the New York Stock Exchange session, 9:30-15:30 (GMT). In the other markets, such as London or Tokyo, this pair does not have much action.
Typically, during the opening hours of the NYSE, a more significant number of transactions takes place, thus increasing the volume in the pair. Take a look at the following chart.
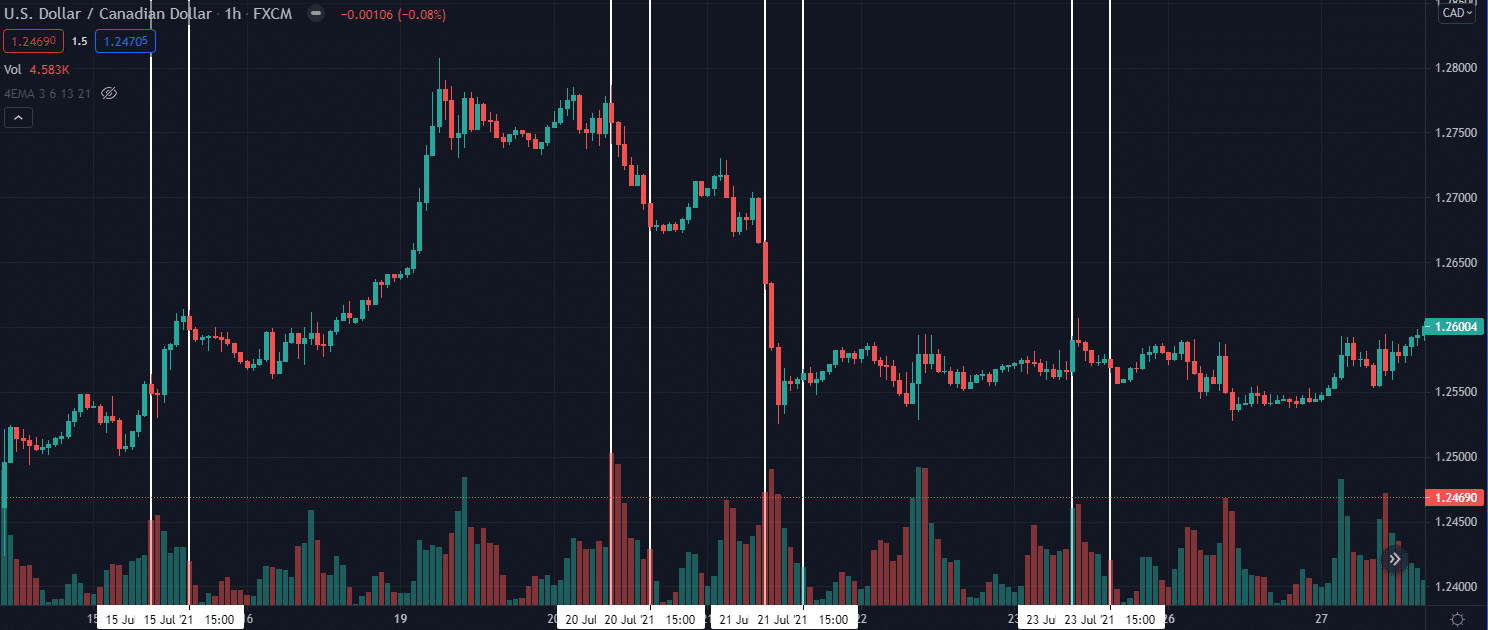
Likewise, there may be some breaking news worldwide that will affect the USDCAD price even if the US market is closed.
Best indicators and strategies to trade the USDCAD
One of the best ways to trade this pair is to combine a significant fundamental factor with a technical analysis based on indicators.
For example, on the date of critical news, you can trade before the opening of the market as long as you take into account what you interpret from your indicator system. Volume-based indicators such as the Accumulation/Distribution (A/D) or Money Flow Index (MFI) can help.
If you see the A/D accompanying the price movement and making a new low, it can be a great entry point to join a trend, either bullish or bearish. Look at the chart below.
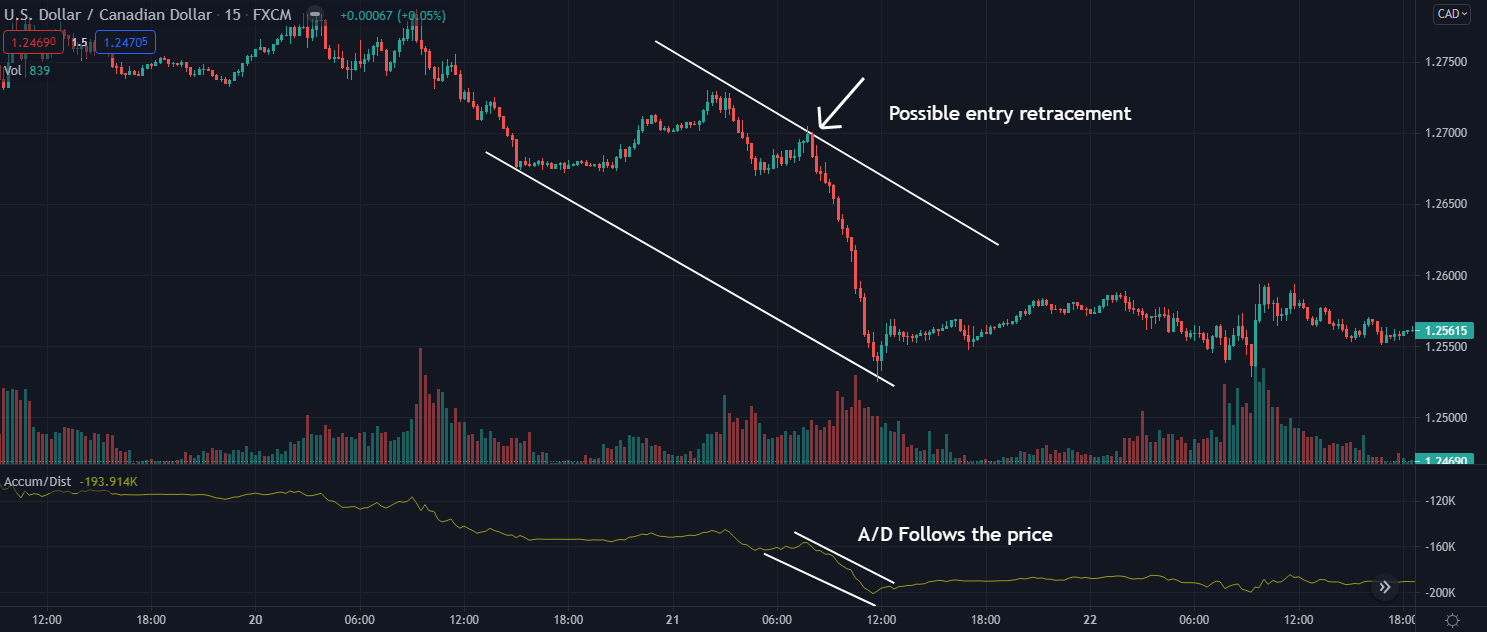
Suppose there is news that strongly impacts the price. In that case, the A/D will tell you how much money is coming in when it is in a range, and thus, know if we are facing a future rise or fall. For example, let’s look at the following chart.
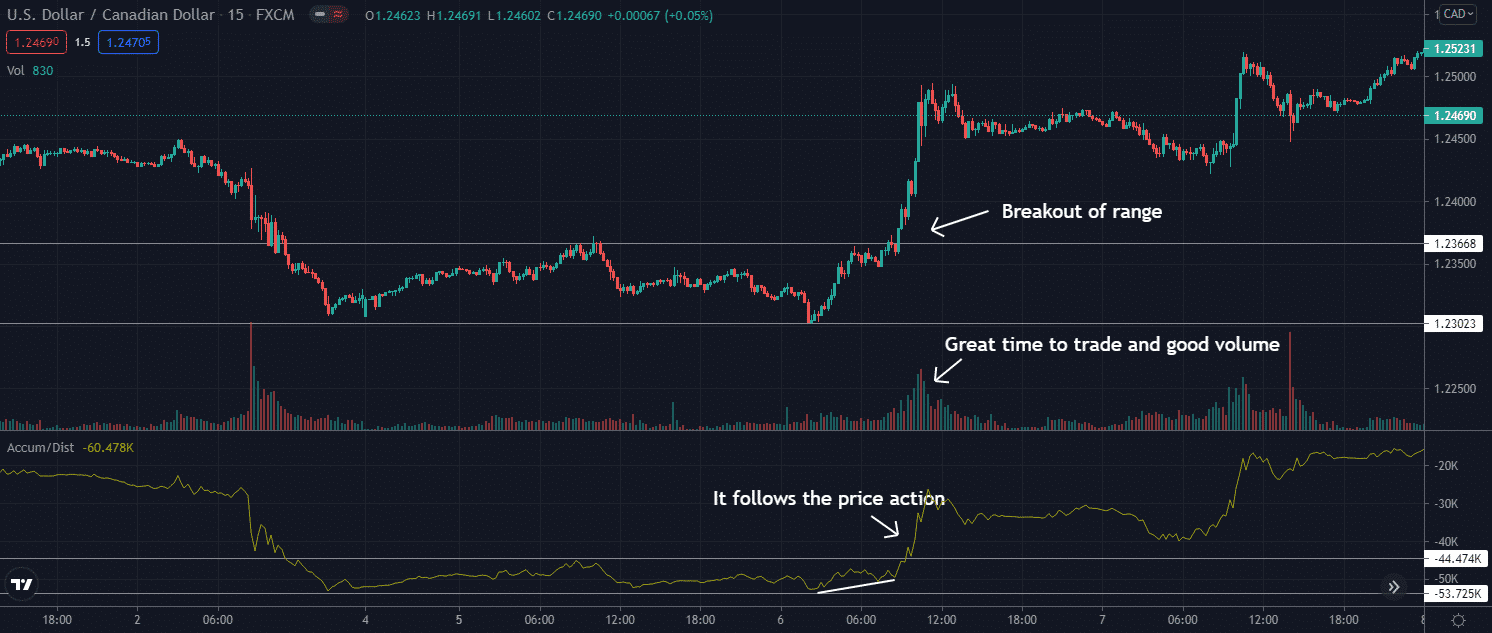
In the chart above, you can see how at the range’s resistance, the A/D indicator accompanied the price. The price action happened during the most active hours of the session, which is suitable to trade the breakout of the range.
Conclusion
Canada and the United States have different economic structures. While Canada leans toward more liberal economic policies and strict immigration regulations, the US depends on the economic boost of educated and talented immigrants to enhance the workforce. The USD benefits from a much larger volume of trading activity, as well as the presence in virtually every primary global industry.
It may seem that the US and Canada are very different. Still, their geographic proximity helps traders, making trading USDCAD easy.
Performing backtesting and analyzing all the aspects we have mentioned will give you a better view of the market and increase the probability of success in your trading.