When looking at trading approaches, it’s important for a trader to study, research, and understand as many as possible and learn to adapt and incorporate them. There are certain trading setups that are more useful than others. Traders can recognize and understand their logic easily and many can fit their trading style. Among the most important trading setups, the Hammer and Shooting Stars are particularly useful.
What are Shooting Stars?
Shooting Stars refer to bearish candlesticks which possess a long upper shadow, almost no or very little lower shadow and a small real body near the low of a day. In other words, it’s a type of candlesticks that appears after an uptrend, forming when a security opens. It then advances significantly, closing the day near the open again.
A candlestick becomes a shooting star if the formation appears during a price advance. The distance between the day’s highest price and its opening price is more than double the body of the shooting star. There is little to no shadow below the real body of the pattern. The formation may produce a false signal if the price rises after a shooting star. It can also mean that the candlestick is marketing a potential resistance area around its price range.
What are Hammers?
Hammers refer to price patterns in candlestick charting. They occur when a security trades significantly lower than its opening price, subsequently rallying within the period to close near its opening price. As a result, it forms a candle stock which is hammer-shaped, where the lower shadow is at least double the size of the real body. The difference between the opening and closing prices is represented by the body. The shadow represents the period’s high and low prices.
Hammers forms when a security declines, which suggests that the market is attempting to find a bottom. Until it is confirmed, a hammer does not indicate a price reversal to the upside.
Hammers and Shooting Stars
Traders who have a bullish bias when the market is in a downtrend often fight the market. They keep buying against the trend all the way down which is a risky approach. Especially if a trader uses Fibonacci levels, they can always find another technical level that justifies their bad trading decisions, making the situation worse.
Traders have a better chance of success if they wait for a clear reversal pattern such as the hammer or shooting star, instead of picking successive levels to buy into a downtrend which is raging. Reversal patterns like these serve as a reminder, letting the trader known when to get into the market. It helps traders clearly define their risk by providing a tradable low to stop loss against.
Hammer and Shooting Stars Examples
Let us assume that it is early May of 2014. For the past few weeks, a trader has been bullish on the USD. He thinks that the whole market has misread the Fed. He expects that the US rates will rise sooner than the market expects.

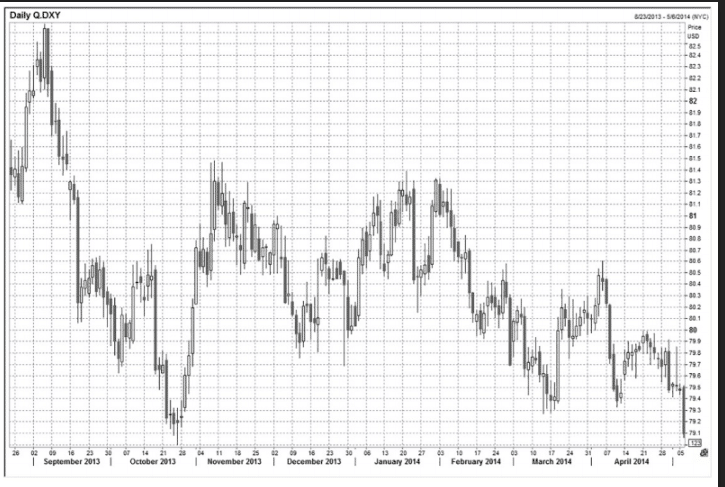
The above chart is from the Daily Dollar Index for the period of August 2013 to May 2014. As evident from it, in October 2013, it forms a big bottom at 79.00. Even though some traders might think that major support is nearby, it’s not a strong enough thesis to pick a bottom on this chart. A few days later, however, the scenario changes.

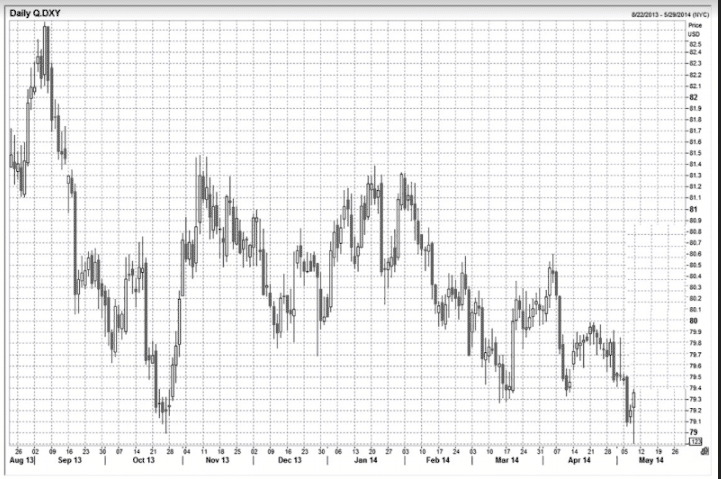
The above chart represents the Daily Dollar Index for August 2013 to May 2014.
Two things are apparent here:
- A Slingshot Reversal through the lows of October 2013.
- A Big Bull hammer bottom.
A clear tradable bottom is now in place in this setup. If the trader holds it, they can rally back all the way to the top of the range at around 81.20. After the hammer bottom, traders have a good enough reason to expect a reversal. They can go long at 79.35, with a stop loss below the low at 78.75.

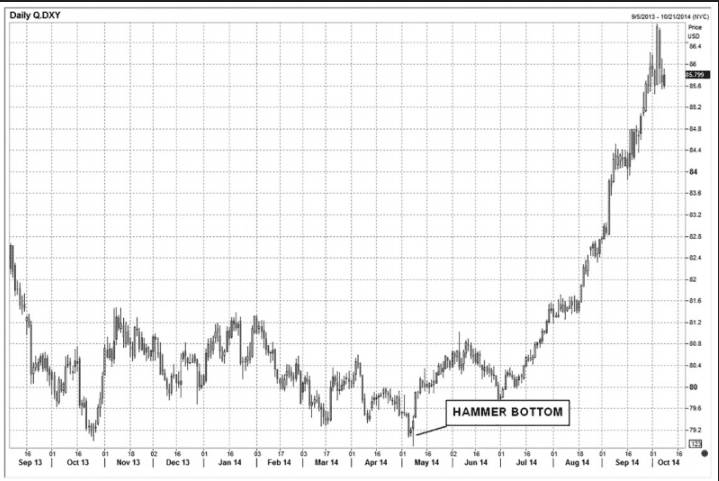
The above is a Daily Dollar Index graph with a hammer bottom from September 2013 to October 2014. It’s a continuation of the previous chart’s price action. The dollar then explodes higher with no chances of turning back.
Traders should know that hammers and shooting stars don’t always work as successfully as the examples here. However, it does provide traders with a strong reversal signal alongside a clear exit point. This can help traders know where exactly they’re wrong, allowing them to size their positions with a decent amount of leverage accordingly. Traders should be patient and only look for hammers and shooting stars when they have a strong countertrend view.
Conclusion
Hammers and Shooting stars are a useful tool which traders can use to get a clear exit point and a strong reversal signal.