The spread position is the difference between the buy (asking price) and the sell (bidding price) in trading. This difference also doubles up as the profit, and the traders look to earn whether he sells or buys the currency. Pips are used to measure the spread: the larger the spread, the higher the earnings. Mean reversion is a retracement in the price that goes back to the previous value regardless of the price movement in a trading chart. Unlike the spread that focuses on growth in the price trend, mean reversions focus on price fluctuations.
A trader planning to invest using mean reversions will hope that the price reverts to the original trendline even when the markets signal extreme conditions. There may be unexpected shifts towards the highs or the lows.
Spread trading

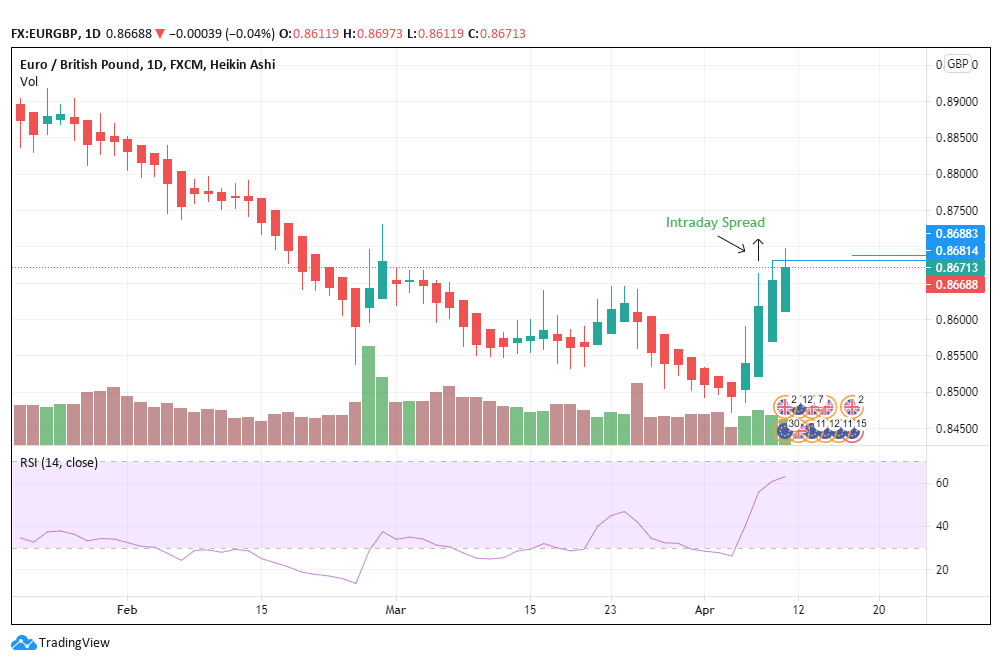
Figure 1: The EUR/GBP trading pair
As of April 9, 2021, brokers offered the intraday bid price at 0.8681 while the ask price was 0.8689.
Bid (selling price) – 0.8681
Ask (buying price) – 0.8689
The spread will be calculated by subtracting 0.8689- 0.8681. The answer is 0.0008. The spread is thus 8 pips. This difference is significant, falling in support of traders that bought or went long for the currency pair rather than those that sold the currency.
Mean reversion

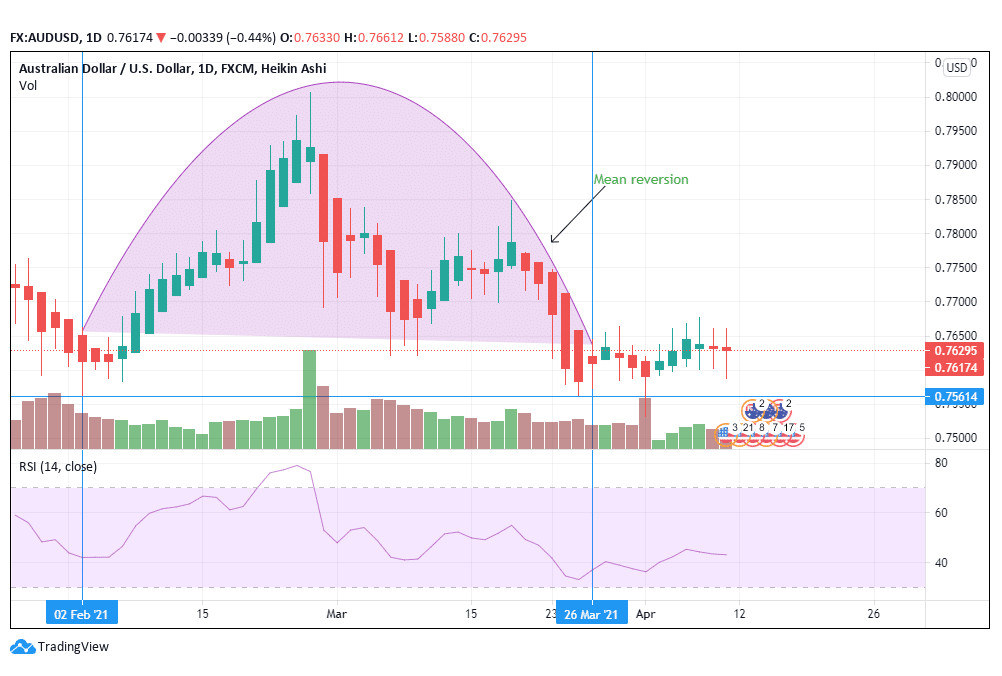
Figure 2: Mean reversion exhibited in AUD/USD
The AUD/USD pair showed a mean reversion from February 2, 2021, to March 16, 2021. Notice how the trend tumbles after it hits 0.7800 from a high of 0.8000. The price continues to decline until it hits a low of 0.7561, where it is at par with the mean price. The mean price is supported by volume similarity. Spreads do not exhibit similar volume trends as it either increases or decreases during the spread duration.
However, some spreads revert to their mean value after a particular time frame. The trader will spot an opportunity when the spread moves further from the mean. He may assume that it will return to its prior value based on historical trendlines. In this case, the mean is estimated to return to the spread value.
Indicators used in mean reversions

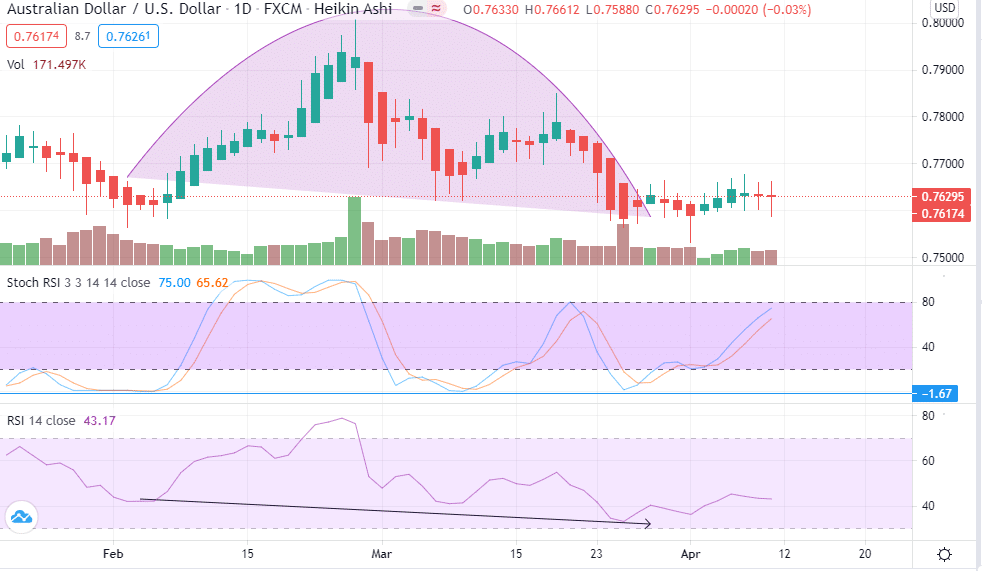
Figure 3: Indicators used in AUD/USD
The mean reversion used in the AUD/USD trading pair could be tracked by applying oscillators. The most common include the relative strength index (RSI) and the Stochastic RSI. The RSI shows the momentum of the asset, in this case, the currency pair. It measures the magnitude of the price changes that have occurred in recent times and how likely the price will oscillate closer to this region. The trader using the RSI will analyze the momentum of the currency to identify if other traders have bought or sold it.
In figure 3, the 14-day RSI is at 43.17, showing reduced buying activity. It is close to neutral, seeing traders are more watchful of a fall rather than an increase in the price of the asset. The RSI is located below the trading/ price chart.
A look at the RSI indicates that it is slightly above the 30, meaning that traders have moved from selling to buying the currency. The trader can spot the price as it reverts to the mean using the RSI.
On its part, the stochastic RSI is an oscillator that measures the consistency of the price ranges. This indicator crossed the mean position three times before rising to the high values. The stochastic RSI is a stronger indicator that identifies the mean value as compared to the RSI.
Spread trading indicators

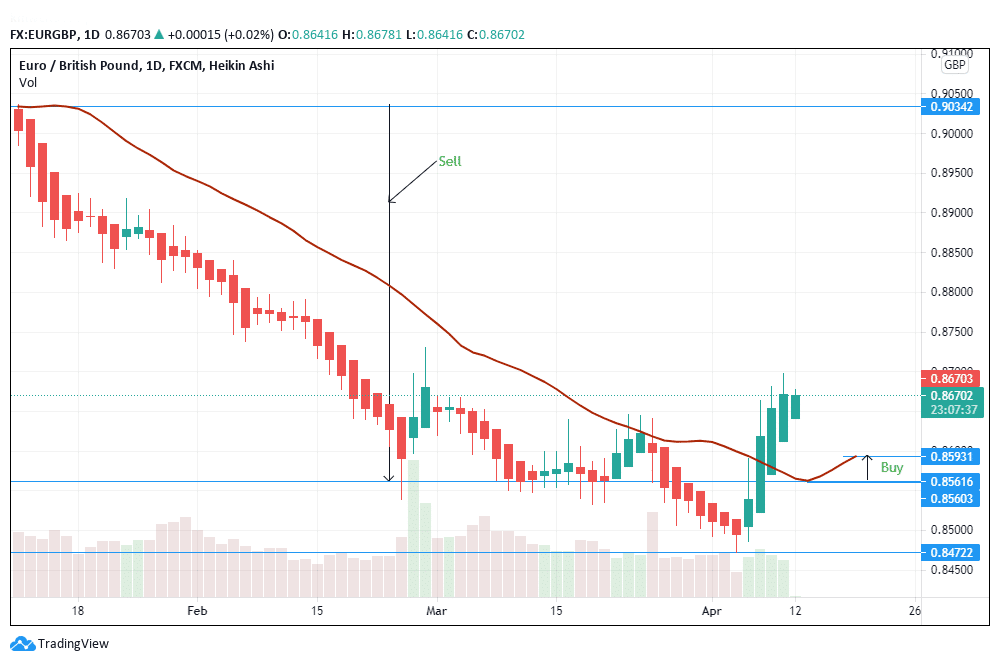
Figure 4: Indicators used in Spread trading
The EUR/GBP currency pair shown above contains the exponential moving average (EMA) as the spread indicator. Figure 4 has identified two spread positions. The EMA identifies the buy and sells signals that should be adopted by the trader. It uses the historical average trade values to give any crossovers or deviations.
The trendline does not cross the 20-day EMA. This conclusion supports the view that the trader should sell as the spread will be inadequate to initiate a buy signal. A shift takes place after the price reaches 0.8560. The price rises, and the 20-day EMA is crossed above 0.0.8593. The change helps price to pick, and the trader will notice the formation of the buy signal. The breakout occurs, leading to a bullish trend at the beginning of April 2021.
The spread analysis also involves analyzing the long-term and short-term moving averages. In our context, the short-term moving average (involving the 20-day EMA) was best effective in identifying the trading spread. Investors willing to go long will prefer to use 100-day or more moving averages.
The trader can intend to apply mean reversion in figure 4 by establishing if the price will revert to 0.8472 as the mean value. This price may, however, not be as significant as 0.8562, where the buy signal was initiated after the sustained downtrend.
Conclusion
The spread position helps the investor to understand the bidding (selling) and asking (buying) price of a currency. This position is vital in estimating the profit that can be accrued from trading in a particular direction. The spread can either favor a buy or a sell, depending on the price trendline. In contrast, mean reversions work on the premise that prices will trend to revert to the mean trading price.
In most cases, mean reversions tend to favor sell as compared to buy positions among traders. Indicators used in spread analysis mostly include moving averages. The trader can judge the movement of a currency by assessing the historical average. Indicators commonly used in mean reversions include oscillators such as the RSI and the stochastic RSI. These pointers focus on the momentum of the currency.