The Awesome Oscillator, abbreviated to AO, is an indicator that helps traders to assess the market momentum. AO computes the difference between a 34-period and 5-period Simple Moving Average. The Simple Moving Averages is not a standard closing price MA but instead the median of each bar. The Awesome Oscillator is generally utilized to confirm the trend of a price movement or anticipate possible trend reversals.
In this guide, we will go through how to detect a buy and a sell signal with the Awesome Oscillator and go through the method to store the data points and how to retrieve them in a trading strategy. MQL4 Awesome Oscillator function retrieves the indicator’s data point, unlike MQL5, which requires the data to be stored in the indicator buffer and in a declared “double type” array. It may seem puzzling, but it is very simple. We will go into the details step by step with this MQL5 specificity. And finally, we will show you a practical usage example of code ready to use.
How does the indicator signal work for the Awesome Oscillator?
Before we go into the details of the Awesome Oscillator code implementation, let us explain the buy and sell signals interpretation. As this indicator is an oscillator, the signal will be mainly obtained from comparing the previous bar reading from the current one to forecast and anticipate the market momentum.
Buy signal
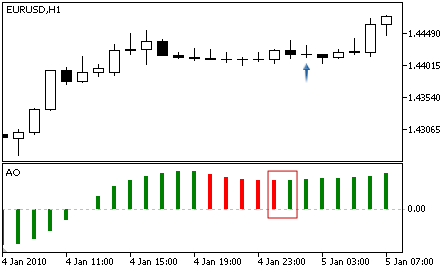
This buy signal with the Awesome Oscillator is named the “saucer.” It happens when the current and previous bar is above zero while the previous price candlestick is bearish, and the current price candlestick is bullish.
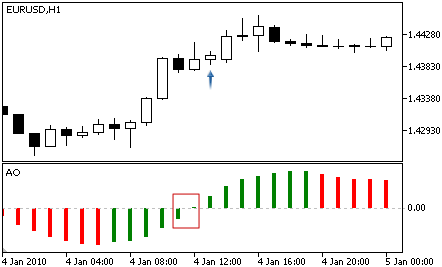
Another buy signal can occur when the Awesome Oscillator bar crosses above the zero line.
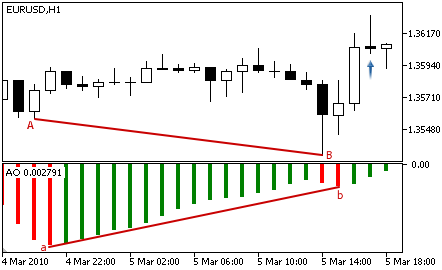
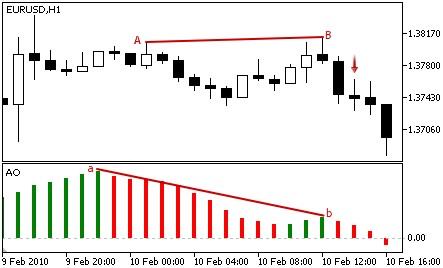
Divergence can be recognized when the price action is trending down, and the Awesome Oscillator bars are trending up in the same range. When a divergence between the indicator and the price action occurs, there is a strong potential for price reversal.
Sell signal
The sell signal for the “saucer” is the opposite of the long “saucer,” in which the oscillator bars, previous and current, must be below the zero lines. In contrast, the previous candlestick must be bullish and the current candlestick bearish.

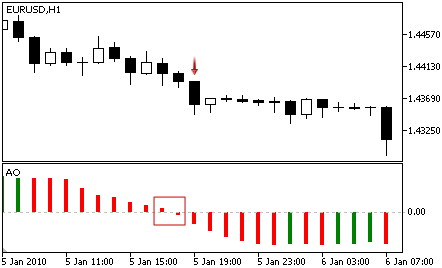
Another sell signal can be found when the Awesome Oscillator bar crosses the zero line. It is a sign of bearishness, therefore, the continuation of a downtrend.
A bearish divergence is represented by the price action to be slightly on an uptrend while the Awesome Oscillator is trending down in the same range. The divergence often arises before a market downturn.
How Awesome Oscillator stores its data points?
The Awesome Oscillator keeps its data point in an indicator buffer which is a dynamic array. The size of the array is managed by MetaTrader during the Expert Advisor initialization. An indicator buffer is a time-series array; hence it has the particularity of reverse indexing. It means that the array is sorted by descending where the latest data point is on the left side of the array. Time-series is used to store historical data and comprise the time information.
Therefore, the time-series element with index zero contains the latest quote of a symbol. For instance, an indicator on the daily timeframe will have the current oscillator bar at index zero and yesterday’s data at the position index one (Fig.156).

Fig.156 Indicator data points array
MQL5
To access the Awesome Oscillator data, MQL5 requires the use of the CopyBuffer() function. This approach does not apply to MQL4 as the MQL4 indicator functions directly return the value of the Oscillator data point instead of the indicator handle. The following parameters should be provided:
- Provide the handle that is returned by the iAO() function
- Provide the buffer number. You may provide zero as the default value.
- Provide the start position. You may provide zero to retrieve from the most recent data point. This number represents the index where zero is the most recent data point, and one is the previous data point.
- Specify the number of data points to get from the iAO() function.
- Provide the variable where the data will be stored. The variable is a double type.
How to retrieve Awesome Oscillator data with CopyBuffer() function?
- Declare a variable for the handle: int IndicatorHandle = iAO();
- Declare a variable to store indicator data: double ao_indicator;
- Copy the data to the indicator variable and retrieve data points:
- CopyBuffer(IndicatorHandle, 0, 0, 100, ao_indicator);
- Retrieve Awesome Oscillator data point with ao_indicator[0], ao_indicator[1].
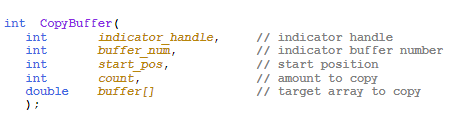
Fig.157 CopyBuffer() Function
How to access the indicator data?
MQL4
The iAO() function will return the bar value according to these three parameters:
- The symbol of the traded instrument. You may provide a string such as “EURUSD” or use the function Symbol() to retrieve the symbol from the chart where the Expert Advisor is attached to.
- Provide the time frame using the enumeration value from the constant ENUM_TIMEFRAMES, for instance:
- PERIOD_CURRENT, for the current timeframe from the chart,
- PERIOD_M1, for the one-minute timeframe,
- PERIOD_D1, for the daily timeframe.
- Provide the index of the indicator buffer where zero is the latest data point and one the previous data point.
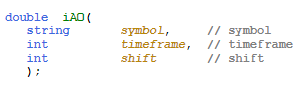
Fig.158 MQL4 Awesome Oscillator function
MQL5
When calling the iAO() function, the function will create the Awesome Oscillator in the MetaTrader global cache and returns its handle according to these provided parameters:
- The symbol of the traded instrument. You may provide a string such as “EURUSD,” or you can use the function Symbol() to get the symbol from the chart where the Expert Advisor is attached to.
- The time frame. Provide the time frame of the data point to extract using the enumeration value from the constant ENUM_TIMEFRAMES:
- PERIOD_CURRENT, to get data points from the current timeframe from the chart to which the Expert Advisor is attached to,
- PERIOD_M1, for the one-minute timeframe,
- PERIOD_D1, for the daily timeframe.
Note that to retrieve data points from the iAO() function, you need to use it in combination with the function CopyBuffer().
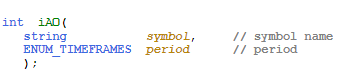
Fig.158 MQL5 Awesome Oscillator function
Practical case
MQL5
Fig.159 demonstrates the use of the Awesome Oscillator to generate a simple signal comparing the previous oscillator bar with the current bar.
Line 237: Declare the indicator handle and assign iAO() function handle with the specified parameters.
Line 238: Declare the indicator “double type” array to store the Awesome Oscillator data points.
Line 240: Copy the latest hundred data points into the indicator array ao_indicator.
Line 242 – 249: IF statement to assess previous bar and current bar value to execute instructions accordingly.
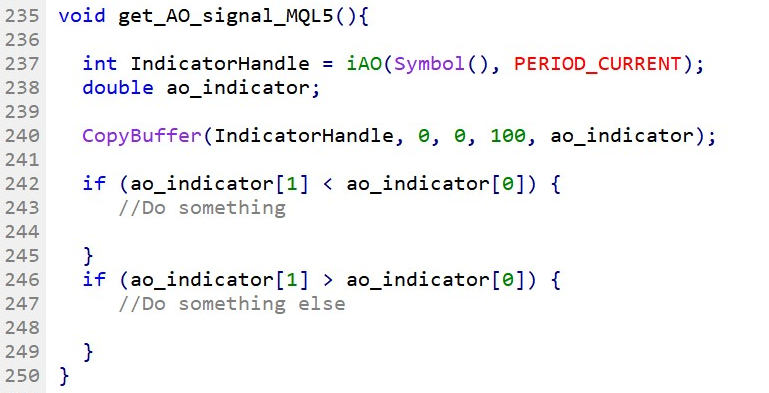
Fig.159 Compare Awesome Oscillator current bar with the previous bar in MQL5
MQL4
Fig.160 demonstrates the use of the Awesome Oscillator to create a simple signal comparing the previous oscillator bar with the current bar.
Line 254 – 255: Declare variables that store the indicator’s data points. Note parameter number three in the function iAO(). The third parameter represents the index of the array element where zero corresponds to the latest data point and one, the previous data point.
Line 257 – 264: IF statement to assess the indicator values by comparing the previous data point with the current data point to execute instructions accordingly.
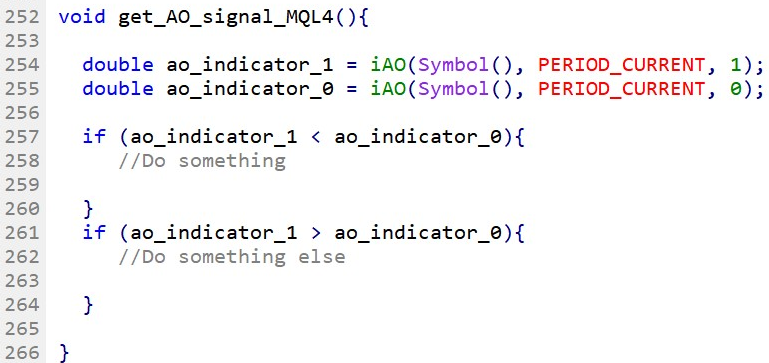
Fig.160 Compare Awesome Oscillator current bar with the previous bar in MQL4