The Ichimoku indicator is a complex technical indicator that comprises a collection of lines that represent multiple averages. It is often called Ichimoku Cloud is composed of five lines, two of which represent the base and the top of the cloud where the difference corresponds to key support or resistance area. By default, the Ichimoku includes the following data points:
- 9-period average (Tenkan-sen)
- 26-period average (Kijun-sen)
- The average of the 9-period and 26-period average (Senkou Span A)
- 52-period average (Senkou Span B)
- Lagging closing price (Chikou Span)
Each of the five lines has a particular functionality:
- The Tenkan-sen is the conversion line calculated by adding the highest high and the highest low over the past 9-period divided by two. It outlines key support and resistance levels.
- The Kijun-sen is the baseline calculated in the same way as the Tenkan-sen, however, on a 26-period basis. This line represents a confirmation bias and often reveals a possible reversal. Traders often used this line to determine the stop loss level.
- The Senkou Span A is a leading span A that consists of the sum of the Tenkan-sen and the Kijun-sen divided by two. The data is plotted on the 26-period ahead, forming one edge of the Ichimoku cloud named the “Kumo.”
- The Senkou Span B is the leading span B calculated in the same way as the Senkou Span A but on a 52-period basis. The resulting line forms the other edge of the cloud named “Kumo.” The gap between Span A and Span B represents the cloud of the Ichimoku indicator.
- The Chikou Span is the lagging span calculated as the current period’s closing price plotted with a 26-period shift back on the chart. The Chikou span offers additional prospective support and resistance areas.
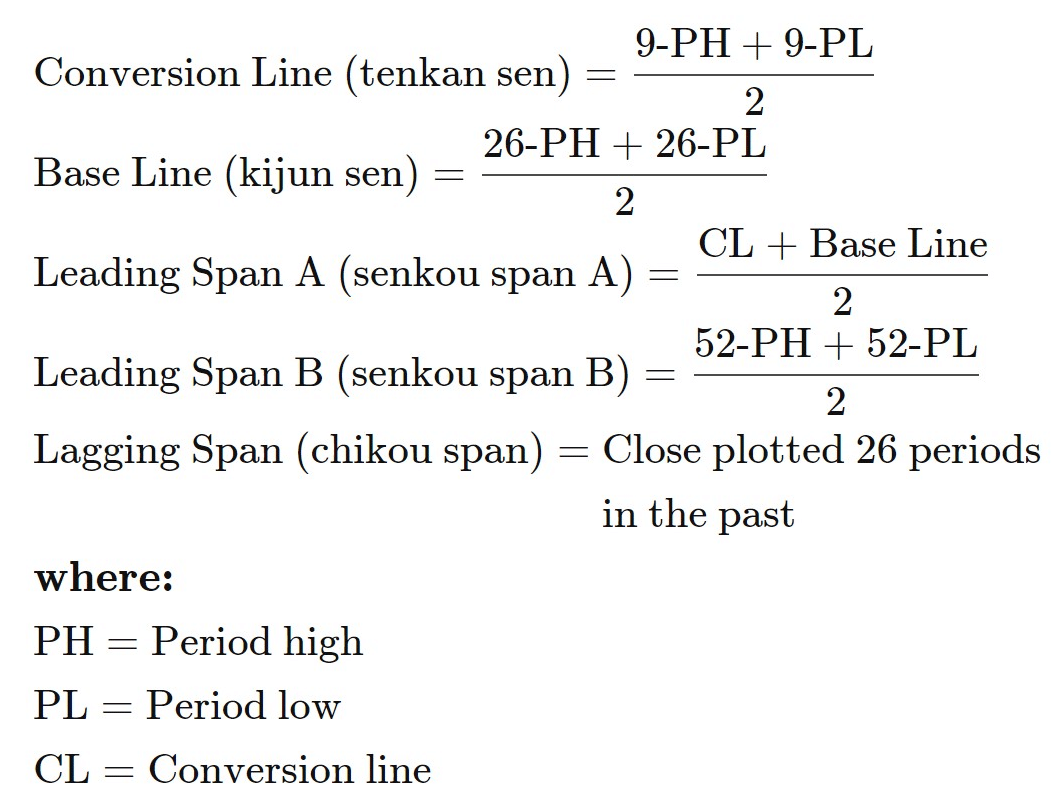
Fig.213 Ichimoku indicator formula
In this guide, we will go through how to detect a buy and a sell signal with the Ichimoku Indicator and explain to you how to store the data points for each of the five lines of the Ichimoku indicator and how to retrieve and exploit them. MQL4 Ichimoku Indicator function retrieves the indicator’s data point directly, unlike MQL5, which requires the data to be stored in the indicator buffer and in a declared “double type” array. Seems confusing? We will explain this specificity step-by-step. And finally, we will show you a practical example of usage.
How does the indicator signal work for the Ichimoku cloud Indicator?
Before we dive into the Ichimoku Indicator code implementation. Let us explain to you how to interpret the multiple data points and lines of the Ichimoku indicator.
As this indicator is based on price averaging on multiple periods, the signal will be construed mainly by line crossover and data points position relative to the underlying price of the traded instrument. There are many ways to read the Ichimoku indicator. The most widely adopted method is the use of the Kumo or cloud, which is the shaded area. The cloud often represents key support or resistance areas. Usually, if the price is above the Kumo (cloud), the momentum is bullish.
Conversely, if the cloud is above the price, the market tends to be bearish. The Chikou span can further confirm the trend and eventually can help traders to anticipate a reversal. On an uptrend momentum, the Chikou span will be moving above the market price. On the contrary, when the trend is down, the Chikou span will be moving below the market price. A reversal may occur if the Chikou span crosses the price of the underlying traded instrument, as shown in Fig.214. The Tenkan-sen and the Kijun-sen act similarly to a standard moving average. Buy and sell signals can be interpreted with the Tenkan-sen and Kijun-sen crossover.
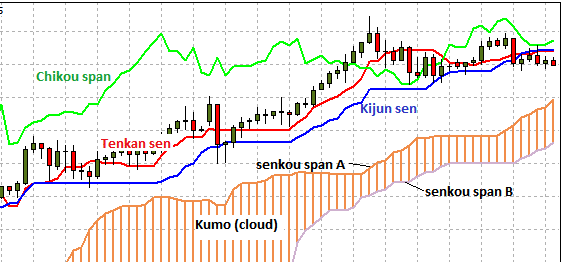
Fig.214 Anatomy of the Ichimoku indicator
Ichimoku Indicator signals, buy, sell, exit
A signal is initiated when a crossover occurs with the Tenkan-sen and the Kijun-sen as illustrated in fig.215 label “TK Bullish cross.” The Tenkan-sen (red line) crossover the Kijun-sen (blue line) with the market price moving above. The underneath Kumo defined by the gap between the Senkou Span A and Span B provide the immediate support area.
When all the lines and data points are aligned with the Tenkan-sen, the Kijun-sen, the Chikou span, and the Kumo, a trend has emerged. To exit a trade, the Chikou span can be used. In the case of a buy, once the Chikou span crosses under the market price, a trend reversal occurs. Hence the long position can be closed.
On The Contrary, for a sell position, when the Chikou span crosses above the market price, a rebound occurs, and therefore the short position can be settled.
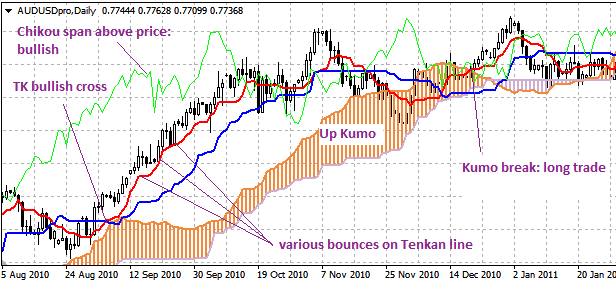
Fig.215 Example of Ichimoku signal interpretation
How the Ichimoku indicator stores its data point
The Ichimoku indicator keeps its data points in an indicator buffer which is a dynamic array. The size of the array is managed automatically by MetaTrader during the Expert Advisor loading phase. An indicator buffer is a time-series array and, therefore, specifically stores its data with reverse indexing. It means that the array is sorted by descending where the most recent data point is on the left side of the array. Time series is used to store historical data and include the time information.
Therefore, the time-series element with index zero contains the latest quote of a symbol. For instance, an indicator on the daily timeframe will have the current price at index zero and yesterday’s data at the position index one.
Note that the Ichimoku Indicator comprises five lines defined by an index to retrieve data from the indicator buffer as follow (fig.216):
- Tenkan-sen, index id zero
- Kijun-sen, index id one
- Senkou span A, index id two
- Senkou span B, index id three
- Chikou span, index id four
Note that the Ichimoku cloud is formed with the Senkou span A and the Senkou span B. On a bullish trend, the Senkou span A represents the top of the cloud, while the Senkou span B defines the base of the cloud. On The Contrary, on a bearish trend, the Senkou span A will be the base while the Senkou span B will symbolize the top of the cloud.
In MQL5, the jaws buffer index is zero, one for the teeth and two for the jaws. This concept of buffer index applies only to MQL5, MQL4 Alligator indicator returns the data point directly according to provided parameters.
The concept of indicator buffer index applies only to the MQL5 environment. MQL4 Ichimoku indicator returns the data point directly according to provided parameters to the iIchimoku() function.
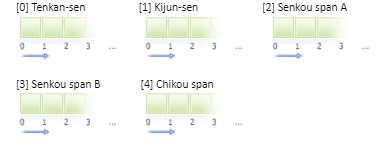
Fig.216 Indicator data points array for the Ichimoku Indicator in MQL5
MQL5
To access the Ichimoku Indicator data, MQL5 requires the use of the CopyBuffer() function. This method does not apply to MQL4 as the MQL4 indicators function directly return the value of the Ichimoku Indicator data point instead of the handle. The following parameters should be provided to collect the data points and store them in the indicator buffer:
- Provide the handle that is returned by the iIchimoku() function
- Provide the buffer number (Fig.216) where:
- Zero is the Tenkan-sen
- One is the Kijun-sen
- Two is the Senkou span A
- Three is the Senkou span B
- And finally, four is the Chikou span
- Provide the start position. You may provide zero to retrieve from the most recent data point. This number represents the index where zero is the most recent data point, and one is the previous data point.
- Specify the number of data points to get from the iIchimoku() function.
- Declare five variables where the data will be stored. The variables must be “double type.”
How to retrieve the indicator data with the CopyBuffer() function?
- Declare a variable for the handle: int IndicatorHandle = iIchimoku().
- Declare five variables to store each of the data set from the indicator buffer:
- double ichi_tks;
- double ichi_kjs;
- double ichi_ssa;
- double ichi_ssb;
- double ichi_cks.
- Copy the data to the indicator variable and retrieve data points:
- CopyBuffer(IndicatorHandle, 0, 0, 100, ichi_tks);
- CopyBuffer(IndicatorHandle, 0, 1 100, ichi_kjs);
- CopyBuffer(IndicatorHandle, 0, 2, 100, ichi_ssa);
- CopyBuffer(IndicatorHandle, 0, 3, 100, ichi_ssb);
- CopyBuffer(IndicatorHandle, 0, 4, 100, ichi_cks).
- Retrieve Ichimoku Tenkan-sen data point with ichi_tks[0], ichi_tks[1].
- Retrieve Ichimoku Kijun-sen data point with ichi_kjs[0], ichi_kjs[1].
- Retrieve Ichimoku Chikou span data point with ichi_cks[0], ichi_cks[1].

Fig.217 CopyBuffer() Function
How to access the Ichimoku indicator data?
MQL4
The ichimoku() function will return the data point according to these seven parameters:
- The symbol of the traded instrument. You may provide a string such as “EURUSD” or use the function Symbol() to retrieve the symbol from the chart where the Expert Advisor is attached to.
- Provide the time frame using the enumeration value from the constant ENUM_TIMEFRAMES, for instance:
- PERIOD_CURRENT, for the current timeframe from the chart,
- PERIOD_M1, for the one-minute timeframe,
- PERIOD_D1, for the daily timeframe.
- Provide the Tenkan-sen data point period. The default value is 9-period.
- Specify the Kijun-sen line period. The default value is 26-period.
- Provide the Senkou span B period. The default value is 52-period.
- Select the source of data to retrieve from the indicator function by providing the following enumeration that represents the five lines of Ichimoku:
- MODE_TENKANSEN, for the Tenkan-sen line data,
- MODE_KIJUNSEN, for the Kijun-sen line data,
- MODE_SENKOUSPANA, for the Senkou span A data points,
- MODE_SENKOUSPANB, for the Senkou span B data points,
- MODE_CHIKOUSPAN, for the Chikou span line data.
- Provide the index value from the indicator buffer where zero is the latest data and one the previous data point.

Fig.218 MQL4 Ichimoku Indicator function
MQL5
When calling the iIchimoku() function, the function will create the Ichimoku Indicator in the MetaTrader global cache and returns its handle according to these five parameters:
- The symbol of the traded instrument. You may provide a string such as “EURUSD,” or you can use the function Symbol() to get the symbol from the chart where the Expert Advisor is attached to.
- Provide the time frame of the data point to extract using the enumeration value from the constant ENUM_TIMEFRAMES:
- PERIOD_CURRENT, to get data points from the current timeframe from the chart to which the Expert Advisor is attached to.
- PERIOD_M1, for the one-minute timeframe
- PERIOD_D1, for the daily timeframe.
- Specify the Tenkan-sen period. The default value is 9-period.
- Provide the Kijun-sen period. The default value is 26-period.
- Indicate the Senkou span period. The default value is 52-period.
Note that to retrieve data points from the iIchimoku() function, you need to use it in combination with the function CopyBuffer(). For each of the five lines of the Ichimoku, indicate the buffer index to retrieve the corresponding data:
- Zero: for the Tenkan-sen
- One: for the Kijun-sen
- Two: for the Senkou span A
- Three: for the Senkou span B
- Four: for the Chikou span

Fig.219 MQL5 Ichimoku Indicator function
Practical case
MQL5
Fig.220 demonstrates the use of the Ichimoku Indicator to generate a buy and sell signal with MQL5.
Line 122: Declare the indicator handle and assign the Ichimoku Indicator data according to indicated parameters.
Line 123 – 127: Declare variables that will be used to store the Ichimoku lines and data points. One variable is declared for each of the five lines that compose the Ichimoku indicator.
Line 129 – 133: Copy the Ichimoku indicator data points to the local buffer. Note that the second parameter 0, 1, 2, 3, and 4 are the buffer indexes that are specific to the Ichimoku lines.
- Zero is to retrieve the Tenkan-sen
- One for the Kijun-sen
- Two for the Senkou span A
- Three for the Senkou span B
- And four for the Chikou span
Line 135: Conditional statement to identify the Tenkan-sen and Kijun-sen crossover, which identifies the first criterion of a sell or buy signal.
Line 139: Conditional statement to confirm that the underlying asset is in an uptrend for the buy signal and in a downtrend for a sell signal.
Line 141: Conditional statement to assess the Ichimoku cloud. When the Senkou span A is above the Senkou span B, the Kumo area acts as the nearest support level. Conversely, when the Senkou span A is below the Senkou span B, the Kumo area represents the nearest resistance level.
Line 149 – 161: Block of conditional statements to recognize a sell signal.
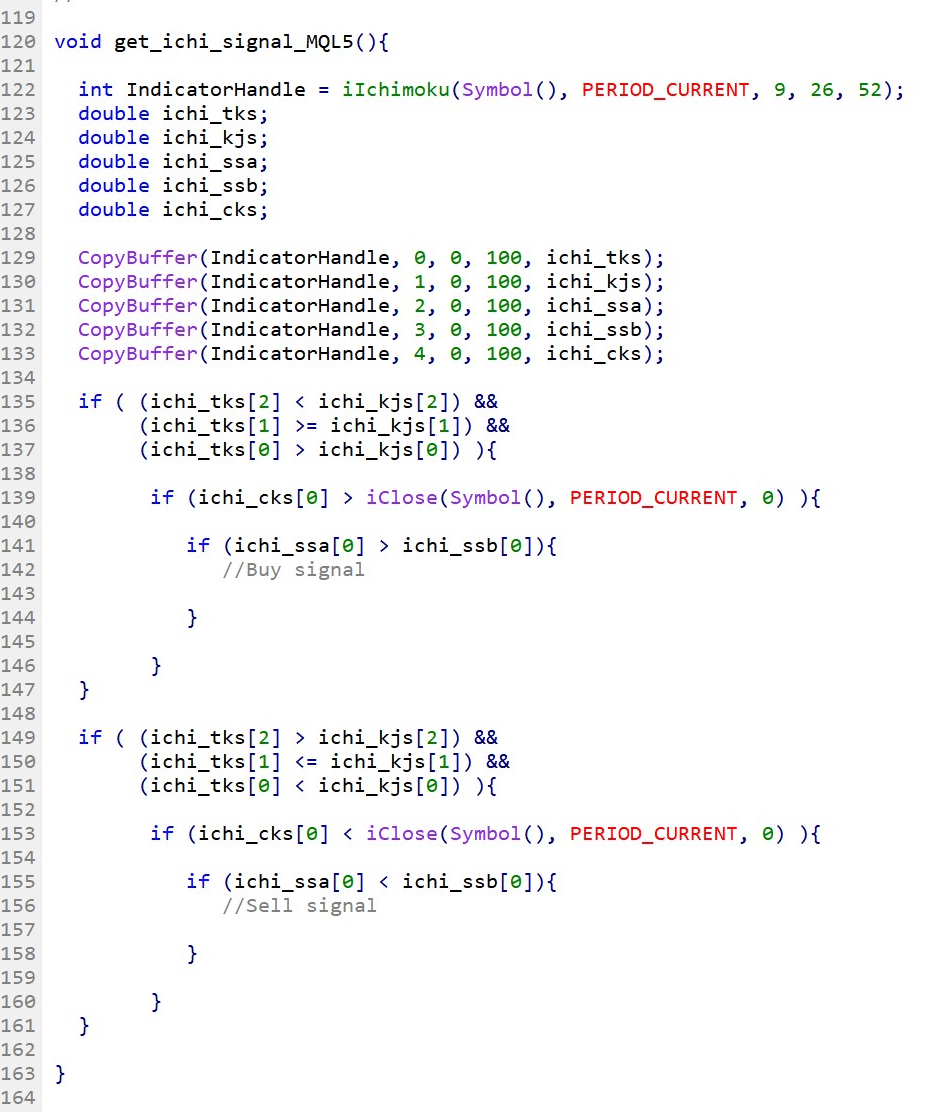
Fig.220 Ichimoku buy and sell signal in MQL5
MQL4
Fig.221 demonstrates the use of the Ichimoku Indicator to generate a buy and sell signal with MQL4.
Line 169 – 177: Declare variables for each data point. Note that in MQL4, the data set and the data point position is defined by the parameter values set to the iIchimoku() function. The last parameter from the function defines the data point shift where zero is the latest data point, and one is the previous data point.
Line 179 – 181: Conditional statement to identify the Tenkan-sen and Kijun-sen crossover, which identifies the first criterion of a sell or buy signal.
Line 183: Conditional statement to confirm that the underlying asset is in an uptrend for the buy signal and in a downtrend for a sell signal by detecting the position of the Chikou span relative to the underlying traded instrument’s price.
Line 185: Conditional statement to assess the Ichimoku cloud. When the Senkou span A is above the Senkou span B, the Kumo area acts as the nearest support level. Conversely, when the Senkou span A is below the Senkou span B, the Kumo area represents the nearest resistance level.
Line 193 – 205: Block of conditional statements to recognize a sell signal.
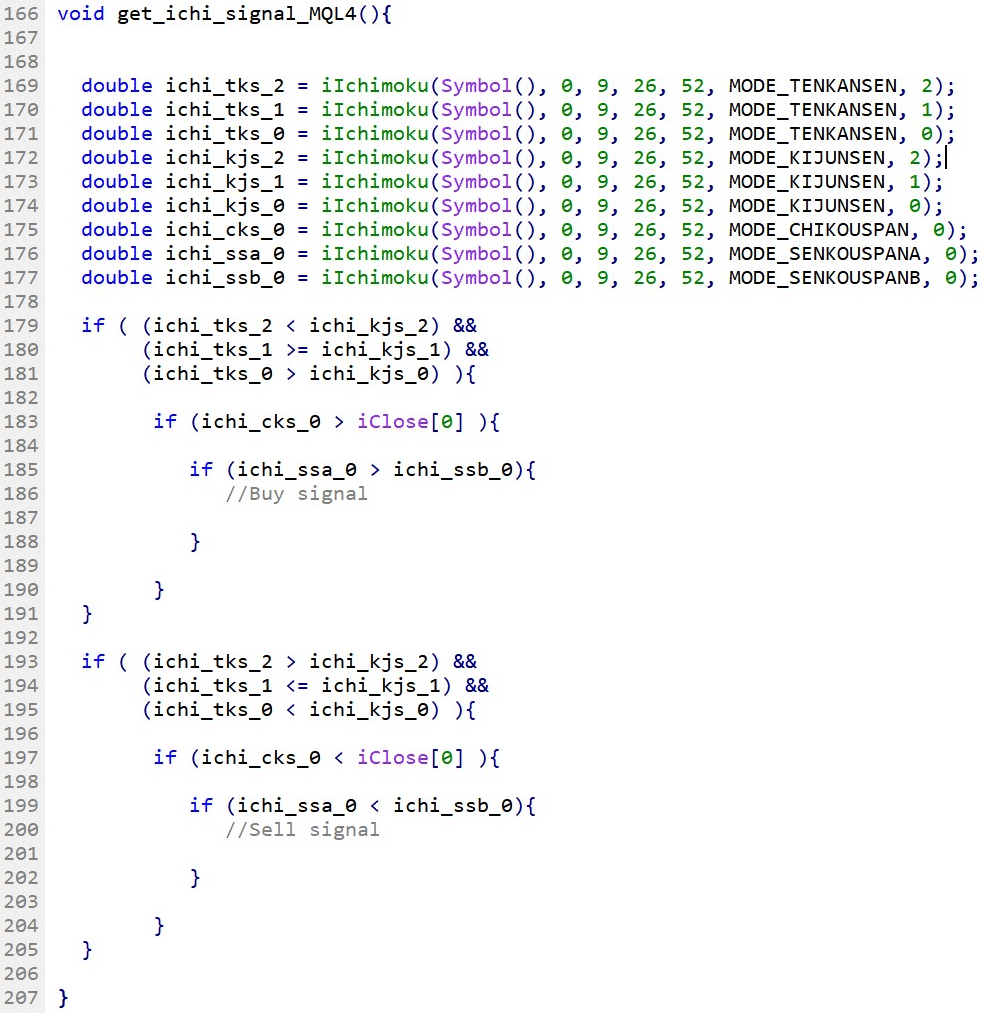
Fig.221 Ichimoku buy and sell signal in MQL4