The Average True Range, abbreviated by ATR, is an indicator that supports traders to assess the market entry and determine the placement of a stop-loss order or an exit strategy. The ATR moves according to the price movement and moves up as the traded instrument appreciates in value and conversely moves down as it depreciates. The ATR indicator comprises a series of “true range values,” which represent the trading range of an instrument for a particular period. A range is the interval of price between the high and the low.
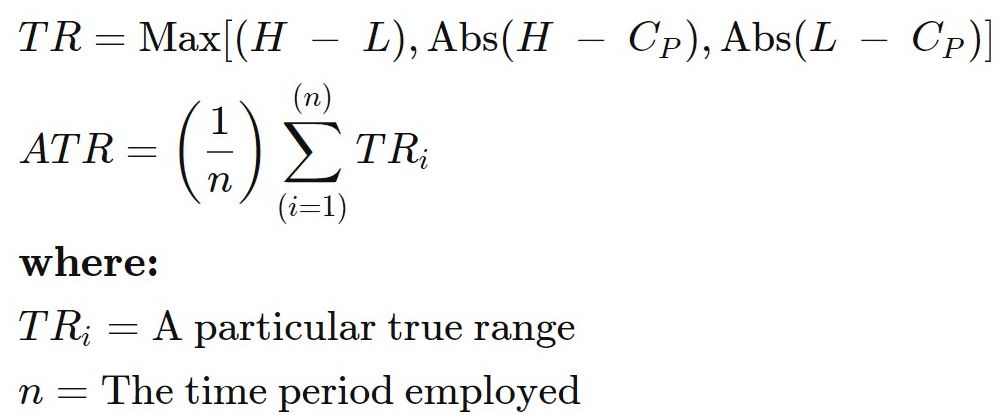
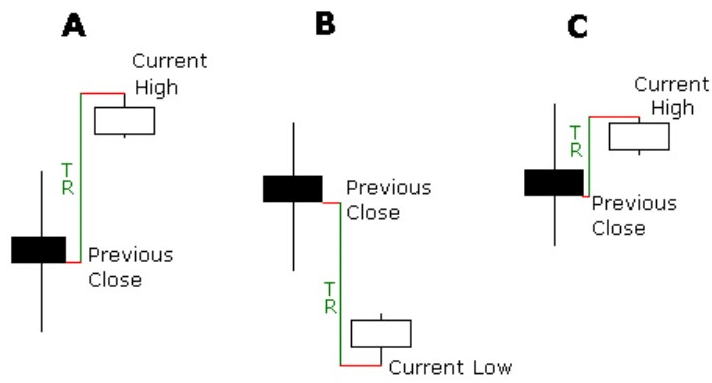
Fig.161 Average True Range formula
In this guide, we will go through how to determine the entry and exit based on the volatility reading with the Average True Range indicator and go through the process to store the data points and how to retrieve them in a trading strategy. MQL4 ATR function retrieves the indicator’s data point, unlike MQL5, which requires the data to be held in the indicator buffer and a declared “double type” array. It may seem confusing, but it is very simple. We will go into the details step by step with these MQL5 particularities. And finally, we will demonstrate to you a practical example of usage with code ready to use.
How does the indicator work for the Average True Range?
Before we go through the details of the ATR code implementation, let us explain the entry and exit signals interpretation. As the ATR is an indicator that gauges the underlying traded instrument’s volatility, the signal will be mainly obtained from evaluating the previous indicator’s points patterns from the current one to assess the market volatility. Usually, when the ATR indicator dips, it means that the market volatility is low and is most likely to trade sideways. On the other hand, when the ATR reading is increasing, volatility in the underlying traded instrument surge. It is recommended to use the ATR in combination with another indicator such as an oscillator or the price action to determine buy and sell signals as the ATR provides mainly the range of volatility which may not be effective to confirm a precise entry and exit point. The approach to use the Average True Range is to enter and exit a trade at volatility peaks and dips, as exhibited in Fig.162 and Fig.163, along with the market trend.
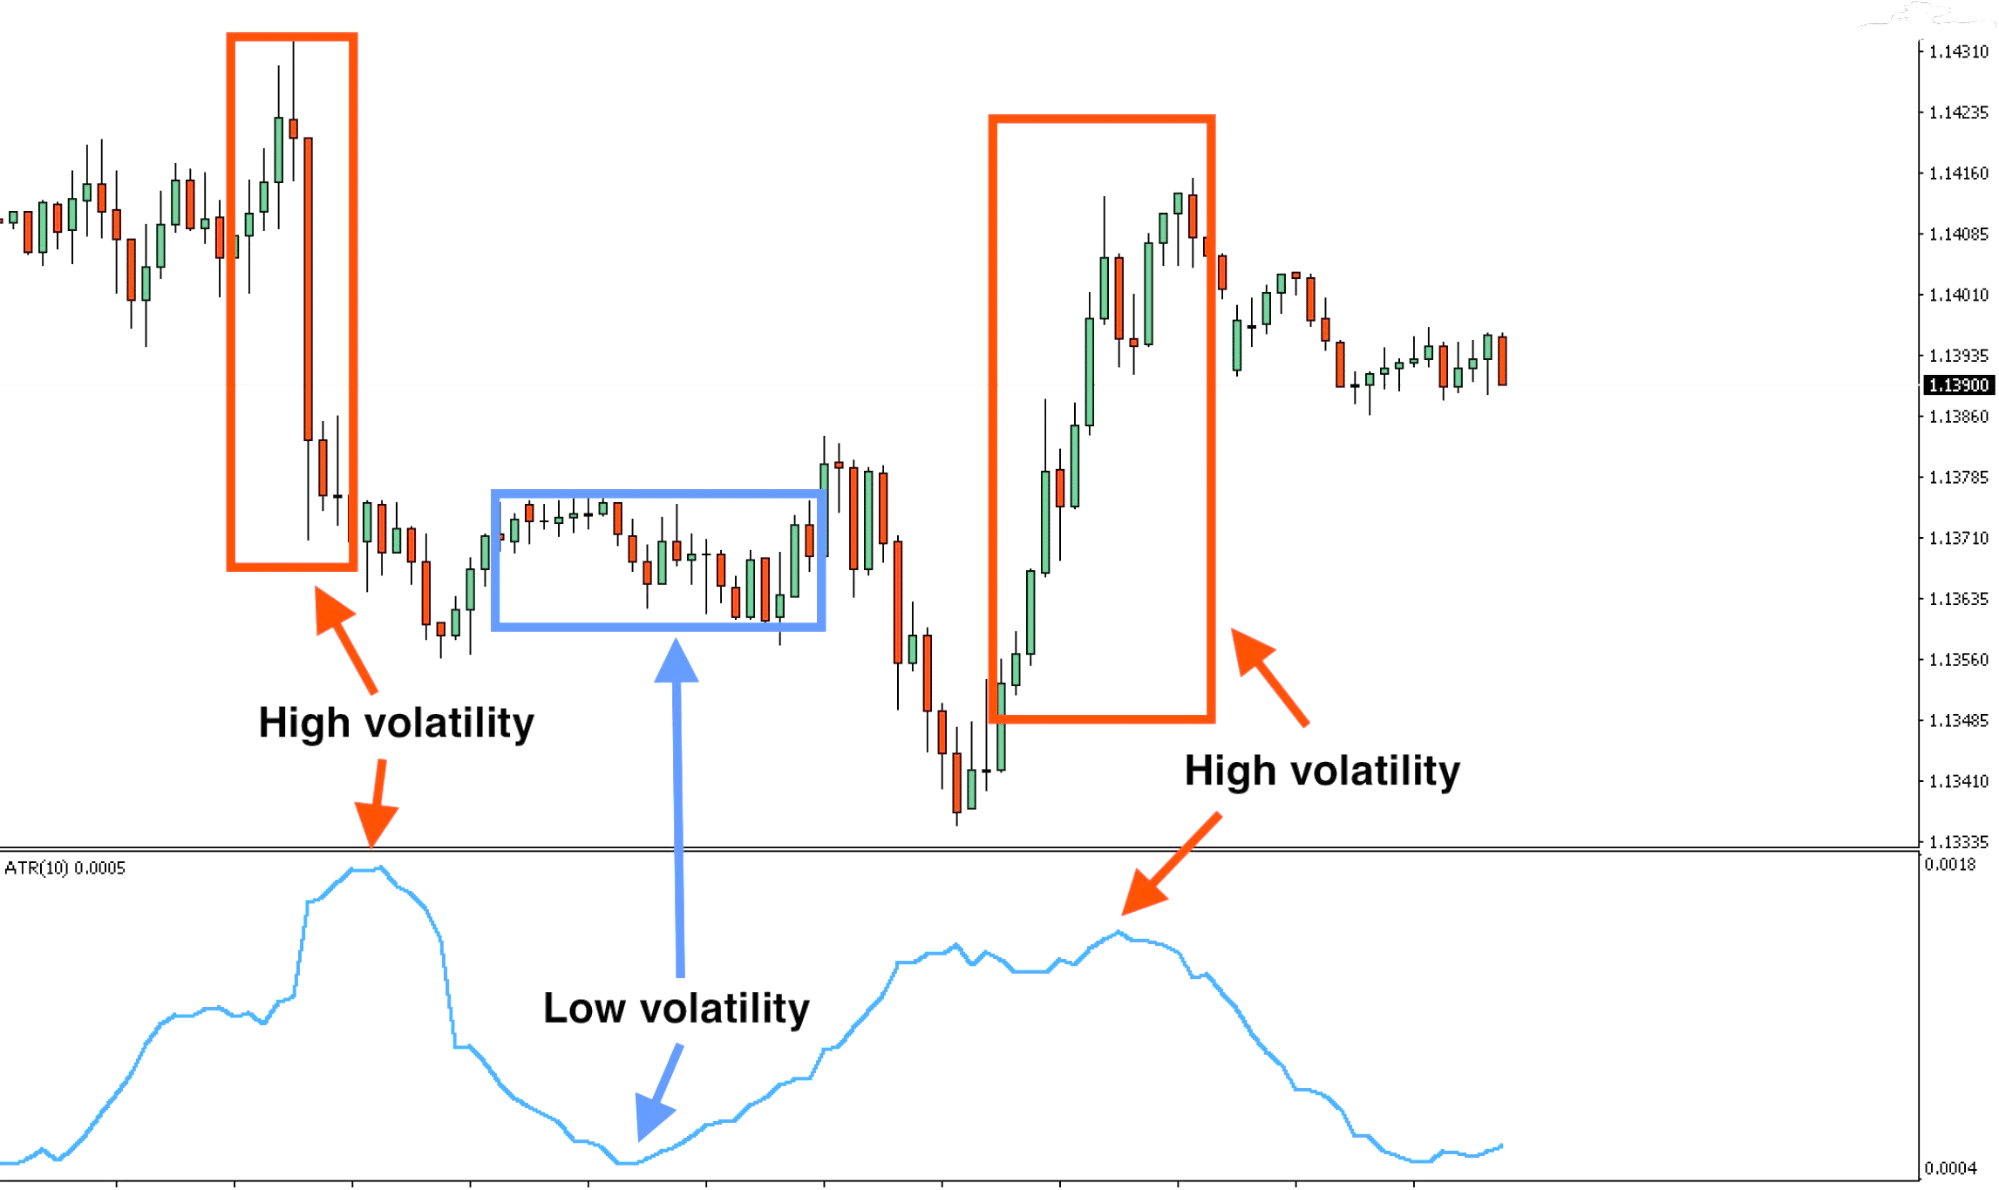
Fig.162 Average True Range, high and low volatility reading
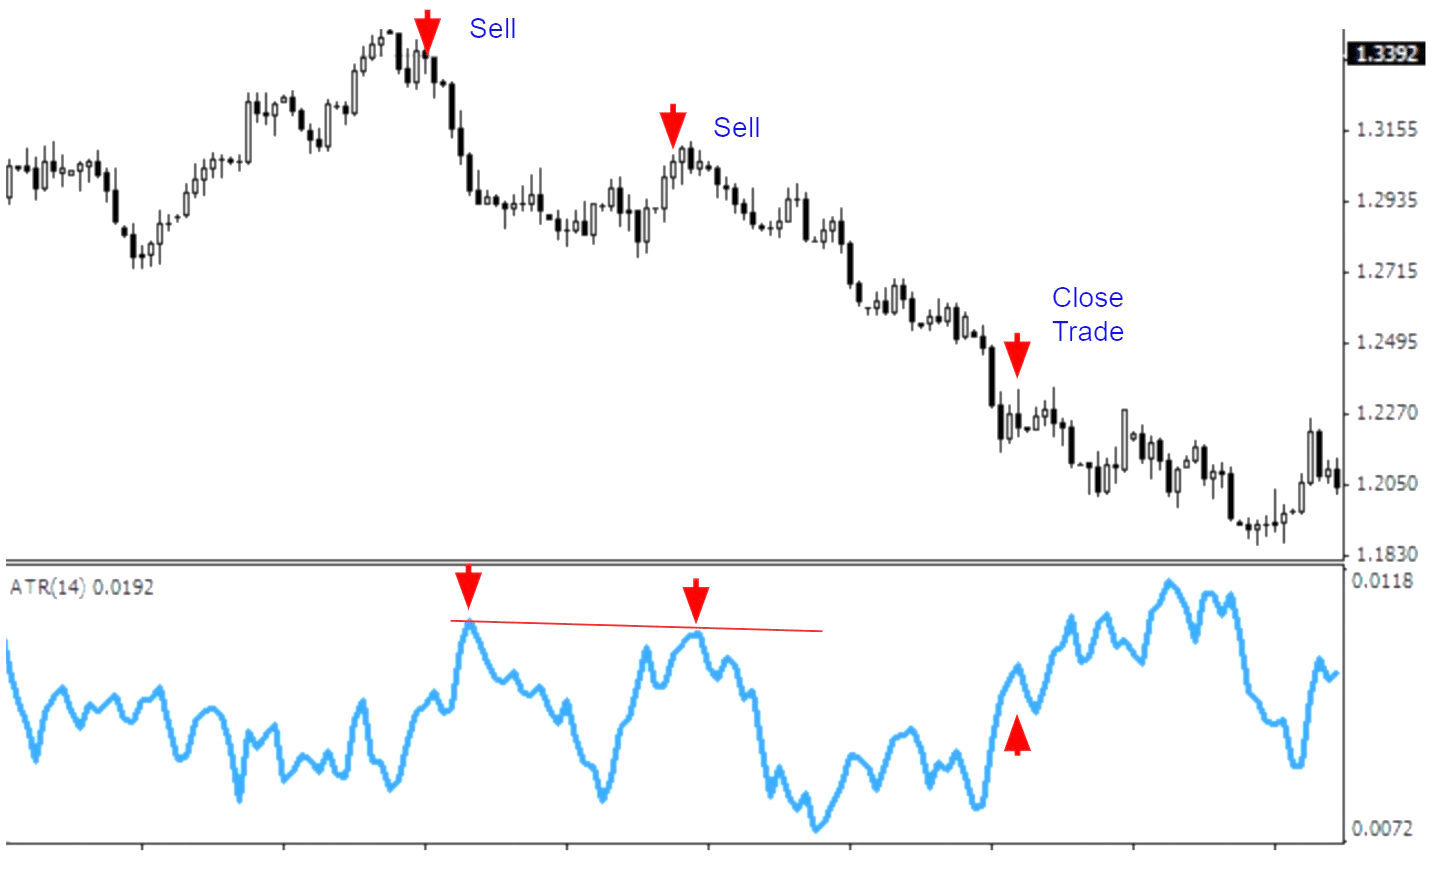
Fig.163 ATR, entry and exit strategy
How the Average True Range stores its data points
The Average True Range saves its data point in an indicator buffer which is a dynamic array. The size of the array is controlled by MetaTrader during the Expert Advisor loading. An indicator buffer is a time-series array; hence it has the distinction of reverse indexing. It implies that the array is sorted by descending where the last data point is on the left side of the array. Time-series is used to store historical data and contain time information.
Hence, the time-series element with index zero contains the latest quote of a symbol. As an example, an indicator on the daily timeframe will have the current data point at index zero and yesterday’s data at the position index one (Fig.164).
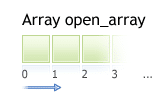
Fig.164 Indicator data points array
MQL5
To get the Average True Range indicator data, MQL5 requires the use of the CopyBuffer() function. This method does not apply to MQL4 as the MQL4 indicators function immediately returns the value of the ATR data point instead of the indicator handle. The following parameters should be provided:
- Specify the handle that is returned by the iATR() function.
- Provide the buffer number. You may provide zero as the default value.
- Provide the start position. You may specify zero to retrieve from the most recent data point. This number characterizes the index where zero is the most recent data point, and one is the previous data point.
- Specify the number of data points to get from the iATR() function.
- Provide the variable where the data will be stored. The variable is a double type.
How to retrieve the Average True Range data with the CopyBuffer() function?
- Declare a variable for the handle: int IndicatorHandle = iATR();
- Declare a variable to store indicator data: double atr_indicator;
- Copy the data to the indicator variable and retrieve data points
- CopyBuffer(IndicatorHandle, 0, 0, 100, atr_indicator);
- Retrieve ATR data point with atr_indicator[0], atr_indicator[1].

Fig.165 CopyBuffer() Function
How to access the indicator data?
MQL4
The iATR() function will return the indicator data point according to these three parameters:
- The symbol of the traded instrument. You may provide a string such as “EURUSD” or use the function Symbol() to retrieve the symbol from the chart where the Expert Advisor is attached to.
- Provide the time frame using the enumeration value from the constant ENUM_TIMEFRAMES, for instance:
- PERIOD_CURRENT, for the current timeframe from the chart,
- PERIOD_M1, for the one-minute timeframe,
- PERIOD_D1, for the daily timeframe.
- Specify the averaging period. Usually, the ATR is a 14-period.
- Provide the index of the indicator buffer where zero is the last data point and one the previous data point.

Fig.166 MQL4 Average True Range function
MQL5
When calling the iATR() function, the function will create the ATR indicator in the MetaTrader global cache and returns its handle according to the following parameters:
- The symbol of the traded instrument. You may specify a string such as “EURUSD,” or you can use the function Symbol() to get the symbol from the chart where the Expert Advisor is attached to.
- Provide the time frame of the data point to extract using the enumeration value from the constant ENUM_TIMEFRAMES:
- PERIOD_CURRENT, to get data points from the current timeframe from the chart to which the Expert Advisor is attached to.
- PERIOD_M1, for the one-minute timeframe
- PERIOD_D1, for the daily timeframe.
- Finally, specify the averaging period of the Average True Range, which is usually a 14-period.
Note that to retrieve data points from the iAO() function, you need to use it in combination with the function CopyBuffer().

Fig.167 MQL5 Average True Range function
Practical case
MQL5
Fig.168 demonstrates the use of the Average True Range to gauge the volatility of the underlying traded instrument and generate a trading signal with the price action trend.
Line 272: Declare the indicator handle and assign iATR() function handle with the specified parameters.
Line 273: Declare the indicator “double type” array to store the ATR data points.
Line 275: Copy the latest hundred data points into the indicator array atr_indicator.
Line 277: Compare the last 100th ATR data point with the latest and current data point to determine the momentum of the volatility of the underlying traded instrument. If the previous ATR data point is lower than the current data point, an increase in volatility has been recognized.
Line 279: Identify the price action trend by comparing the last 100th “closed price” from the underlying traded instrument with the current one. If the previous price is lower than the current one, an uptrend can be assumed.
Line 282: If the previous 100th “closed price” is higher than the current “closed price,” a downtrend is recognized.
Line 287: The IF statement validates a decrease in volatility based on the previous 100th ATR data point and the current data point.
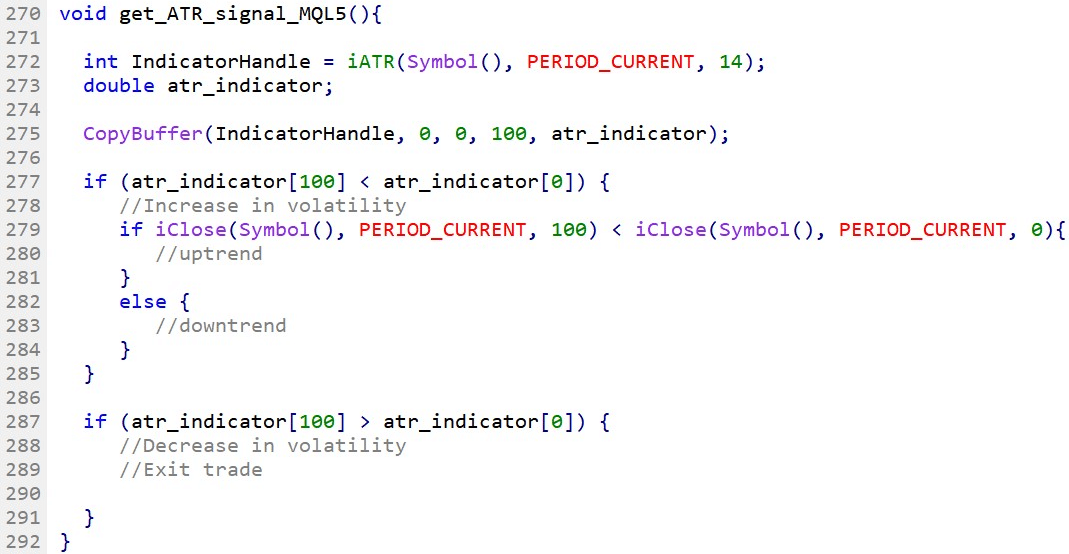
Fig.168 Compare Awesome Oscillator current bar with the previous bar in MQL5.
MQL4
Fig.169 demonstrates the use of the Average True Range to gauge the volatility of the underlying traded instrument and generate a trading signal with the price action trend.
Line 296 – 297: Declare variables that store the indicator’s data points. Note parameter number four in the function iATR(): it represents the index of the array element where zero corresponds to the latest data point and hundred, the previous 100th data point.
Line 299: Compare the 100th previous ATR data point with the current data point to determine the volatility momentum of the underlying traded instrument.
Line 301: Identify the price action trend. If the previous close price is smaller than the current close price, an uptrend is recognized. Conversely, if the previous close price is higher than the current close price, a downtrend can be assumed.
Line 309: The IF statement compares the previous 100th ATR data point with the current data point to validate the decrease in volatility.
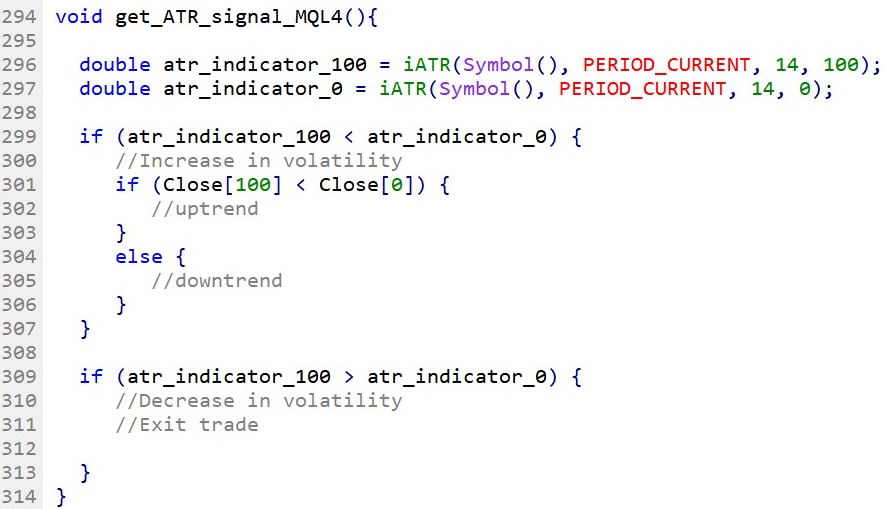
Fig.169 Compare Awesome Oscillator current bar with the previous bar in MQL4