The Commodity Channel Index, abbreviated by CCI, is a technical indicator that effectively determines and measures the amplitude of price extension due to overbought and oversold conditions. It allows the trader to gauge the momentum of the underlying traded instrument. As detailed in Fig.177, the CCI indicator measures the difference by comparing the current price and the historical average price. When the indicator reading is above zero, it implies the price is above the historical average. On the other hand, when the CCI is below the zero thresholds, the current price is below the historical average. Unlike most of the oscillators, the CCI indicator is an unbounded oscillator; hence, it can go higher or lower indefinitely. To gauge the overbought and oversold territory, the trader must compare the actual indicator value with the historical indicator values.
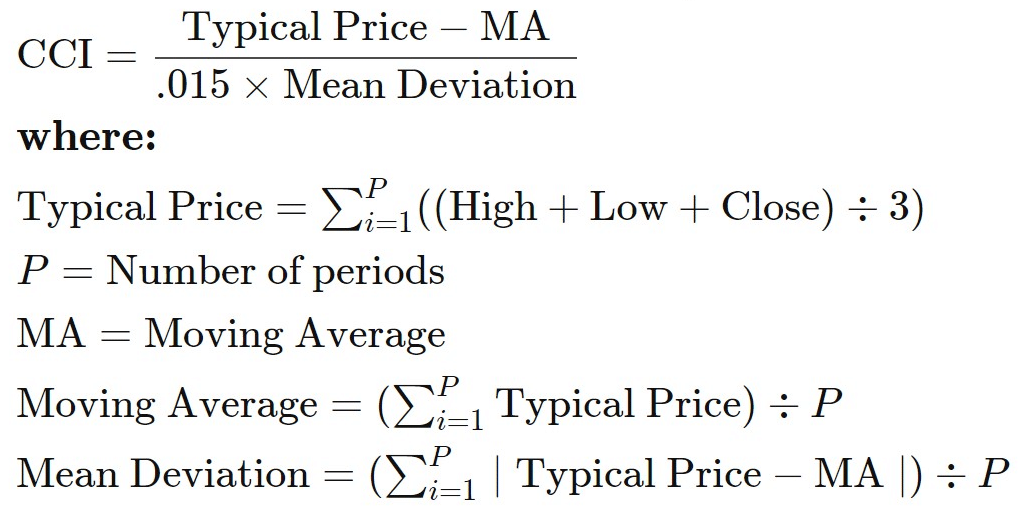
Fig.177 Commodity Channel Index (CCI) formula
In this guide, we will go through how to detect a buy and a sell signal with the Commodity Channel Index and demonstrate how to store the indicator data points and retrieve the information for further use.
The CCI function in MQL4 retrieves the indicator data points, contrasting with MQL5, which requires the data to be saved first in the indicator buffer initialized by MetaTrader and declared as a double type array. We will analyze this specific MQL5 feature in much detail. And finally, we will give you an example of practical usage.
How does the indicator signal work for the Commodity Channel Index?
Before we go through the details of the Commodity Channel Index code, let us describe the buy and sell signals interpretation. The indicator is an unbound oscillator that must be compared to previous values to determine the momentum of the underlying traded instrument. Hence, the oversold and overbought levels can be customized according to the historical CCI values.
Buy signal
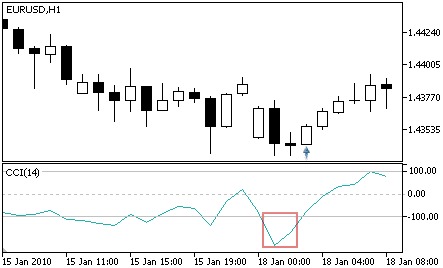
Oversold trend reversal: A buying opportunity can be captured when the CCI indicator reverses from its oversold level.
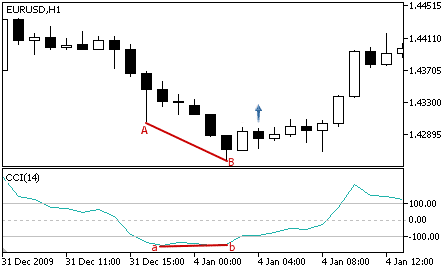
Bullish divergence: The CCI indicator is trending up from its oversold level while the underlying instrument continues its downward trajectory. A divergence between the price and the CCI indicator suggests an imminent trend reversal which is a bullish signal.
Sell signal
Overbought trend reversal is the exact opposite of an oversold trend reversal pattern. A sell signal is triggered when the CCI indicator reaches its peak and reverses downward back to its median level, followed by the decline in the underlying instrument price.
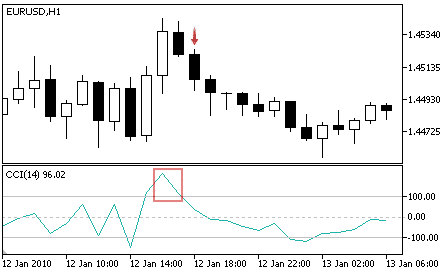
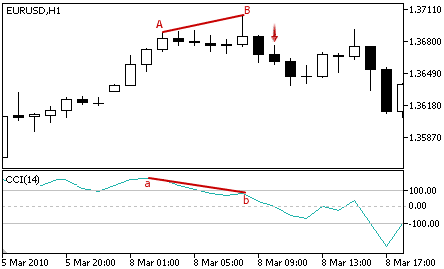
Bearish divergence: The CCI indicator is evolving above its overbought territory and starts to form a downward trend while the underlying instrument price continues to move higher. A divergence between the indicator and the instrument price is a pattern that indicates an imminent trend reversal, hence in that case, a sell signal.
How the Commodity Channel Index stores its data points?
The Commodity Channel Index saves its data point in a dynamic array in the indicator buffer. The size of the array is automatically allocated and updated by MetaTrader itself during the Expert Advisor loading phase. An indicator buffer is a time series array, thus, it has the distinctive feature of reverse indexing. It implies that the values sorted in the array are descending, and the last data point is on the left side of the array. The timeseries array is employed to store historical data and comprises the time information.
Hence, the timeseries element with index zero contains the latest quote of a symbol. For instance, an indicator on the daily timeframe will have the current price at index zero and yesterday’s price at the position index one (Fig.178).

Fig.178 Indicator data points array
MQL5
To access the Commodity Channel Index data, MQL5 requires the CopyBuffer() function. This approach does not relate to MQL4 as the iCCI() function in MQL4 directly returns the value of the indicator data points instead of its handle, or ID. The following parameters should be specified:
- Provide the handle that is returned by the iCCI() function.
- Provide the buffer id, which is zero, as the CCI indicator contains only one series of values.
- Provide the start position where zero is the most recent data point. For instance, on a daily time frame, zero is the current data point, and one is yesterday’s data point.
- Specify the number of data points to retrieve from the iCCI() function.
- Provide the variable where the data will be stored.
How to retrieve the Commodity Channel Index data with CopyBuffer() function?
- Declare a variable for the handle: int IndicatorHandle = iCCI();
- Declare the variable cci_indicator to store the collected data points.
- Copy the data to the indicator variable and retrieve data points from the CCI indicator
- CopyBuffer(IndicatorHandle, 0, 0, 100, cci_indicator);
- Retrieve the Commodity Channel Index data points with: cci_indicator[0], cci_indicator[1]

Fig.179 CopyBuffer() Function
How to access the indicator data?
MQL4
The iCCI() function returns directly data points of the indicator according to five provided parameters:
- The symbol of the traded instrument. You may provide a string such as “EURUSD” or use the function Symbol() to retrieve the symbol from the chart where the Expert Advisor is attached to.
- Provide the time frame using the enumeration value from the constant ENUM_TIMEFRAMES, for instance:
- PERIOD_CURRENT, for the current timeframe from the chart
- PERIOD_M1, for the one-minute timeframe,
- PERIOD_D1, for the daily timeframe.
- Provide the averaging period, for instance, 14 for the 14-period.
- Provide the applied price method using the ENUM_APPLIED_PRICE constant:
- PRICE_CLOSE: for close price
- PRICE_OPEN: for open price
- PRICE_HIGH: for the highest price within the defined averaging period.
- PRICE_LOW: for the lowest price within the defined averaging period.
- Provide the element index where zero is the latest data point, and one is the previous data point.
iCCI() function will return the data point according to the specified parameters.

Fig.180 MQL4 Commodity Channel Index function
MQL5
When calling the iCCI() function, the function will create the Commodity Channel Index in the MetaTrader global cache and returns its handle according to this provided information:
- The symbol of the traded instrument. You may provide a string, such as “EURUSD,” or you can use the function Symbol() to get the symbol from the chart where the Expert Advisor is attached to.
- Provide the time frame of the data point to extract using the enumeration value from the constant ENUM_TIMEFRAMES:
- PERIOD_CURRENT, to get data point from the current time frame from the chart to which the Expert Advisor is attached to,
- PERIOD_M1, for the one-minute timeframe,
- PERIOD_D1, for the daily timeframe.
- Finally, provide the averaging period, for instance, the most commonly used 14-period.
- Provide the applied price method using the ENUM_APPLIED_PRICE constant:
- PRICE_CLOSE: for the close price,
- PRICE_OPEN: for the open price,
- PRICE_HIGH: for the highest price within the defined averaging period,
- PRICE_LOW: for the lowest price within the defined averaging period.
Note that to retrieve data point from the iCCI() function, you need to use it in combination with the function CopyBuffer():
- CopyBuffer(IndicatorHandle, 0, 0, 100, cci_indicator)
- cci_indicator[0], cci_indicator[1]

Fig.181 MQL5 Commodity Channel Index function
Practical case
MQL5
Fig.182 demonstrates the use of the Commodity Channel Index with MQL5 to generate a simple signal comparing the indicator historical data points and the underlying traded instrument price to spot bullish and bearish divergence.
Line 372: Declare the indicator handle and assign the value of the iCCI() function handle.
Line 373: Declare the variable that will store data points from the CCI indicator.
Line 375 – 376: Declare the variables that define the oversold and overbought conditions.
Line 378: Collect and save data points using the CopyBuffer() function to the cci_indicator variable.
Line 380 – 404: Nested IF statement block to identify bullish and bearish divergence. A divergence is recognized when the CCI indicator and the price action trend move in a different direction.
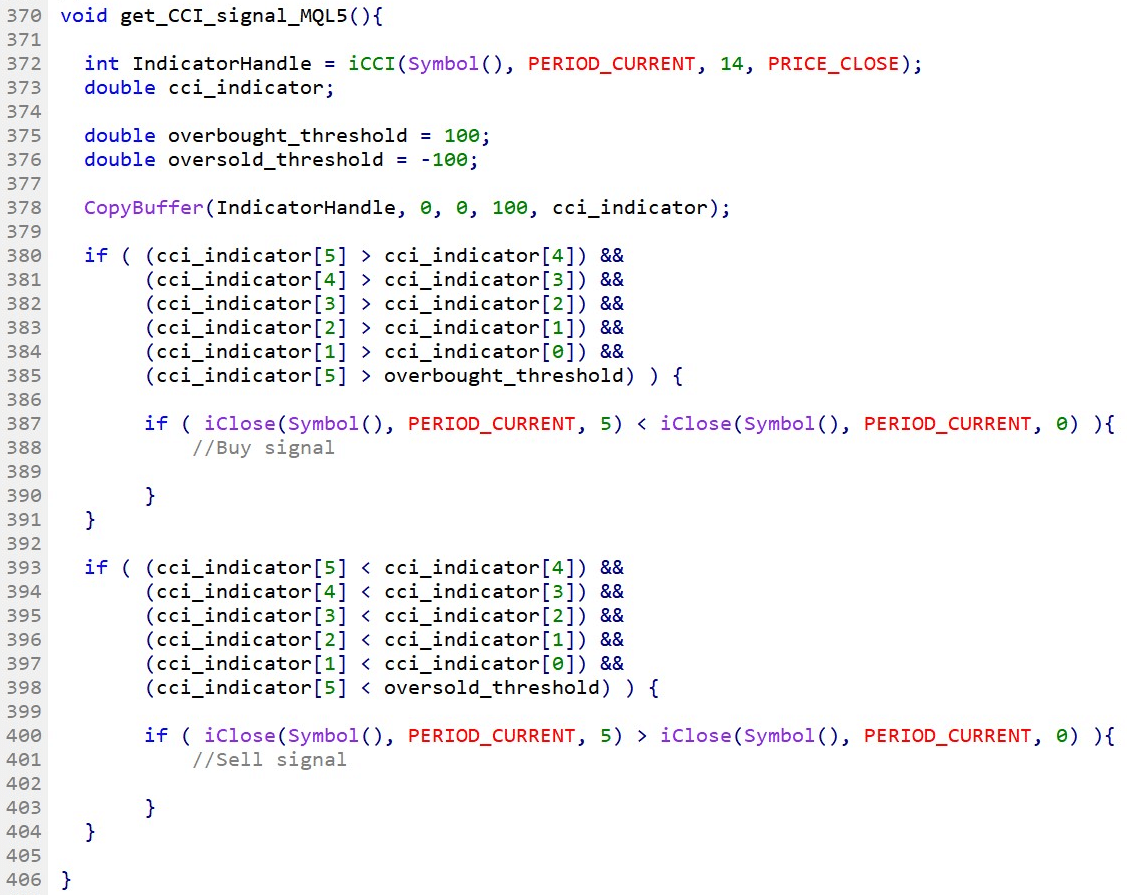
Fig.182 MQL5 example of a bullish and bearish divergence trading signal with the CCI indicator.
MQL4
Fig.183 demonstrates the use of the Commodity Channel Index to generate with MQL4 a simple signal comparing the indicator historical data points and the underlying traded instrument price to spot bullish and bearish divergence.
Line 411 – 416: Declare variables that will store iCCI() data points for each respective CCI data points in the timeseries. Take note of the last parameters, which is the index of the data point element, where zero is the most recent data point.
Line 418 – 419: Declare variables that define the overbought and oversold conditions.
Line 421 – 445: Nested IF statement block to identify bullish and bearish divergence. A signal is triggered when the CCI indicator and the price action trend move in a different direction.
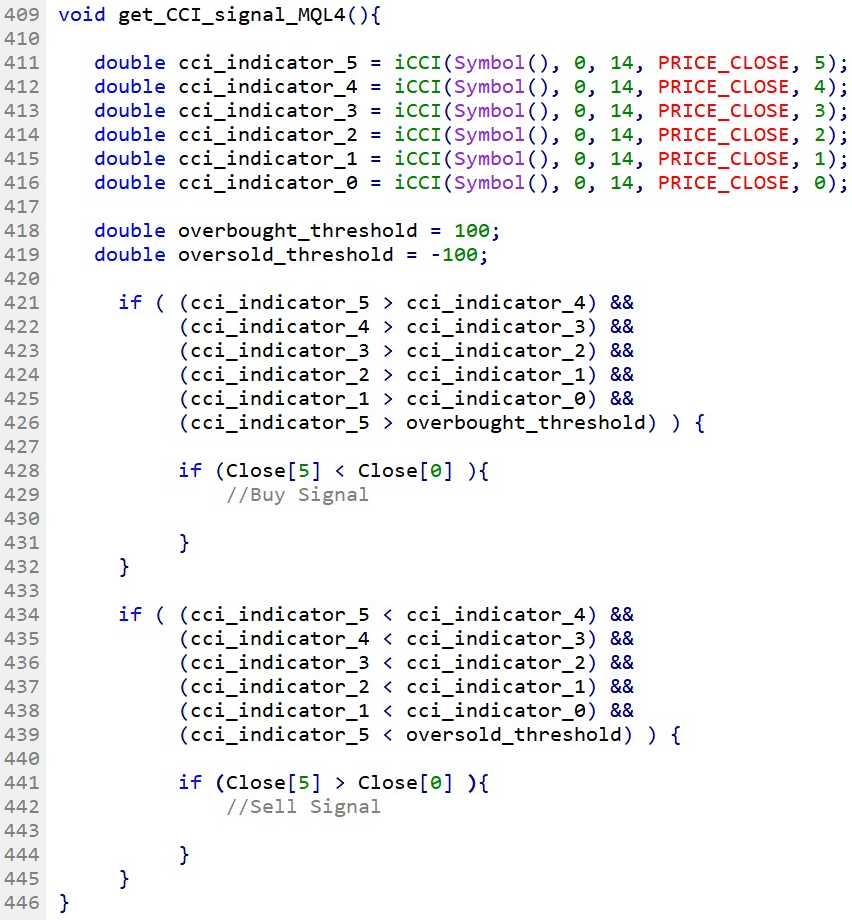
Fig.183 MQL4 example of a bullish and bearish divergence trading signal with the CCI indicator