The DeMarker indicator measures the velocity of the price action directional trend by comparing the most recent highs and lows to the previous period’s equivalent price to assess the supply and demand for the underlying traded instrument. This indicator is useful to determine entry and exit levels.
In this guide, we will go through how to detect buy and sell signals with the DeMarker oscillator and explain to you how to store the data points and how to retrieve them for further use. MQL4 DeMarker function retrieves the indicator’s data point. Conversely, the MQL5 platform requires the data to be stored in the buffer, and a declared “double type” array.
This feature may seem confusing, but you will see how straightforward it really is when you analyze it with us.
To conclude this guide, we will show you a practical example of usage.
How does the indicator signal work for the DeMarker oscillator?
Before we dive into the DeMarker indicator code implementation, let us explain the buy and sell signals interpretation. As this indicator is an oscillator, the signal will be mainly derived from comparing the previous bar reading from the current one to project and anticipate the market movement.
Buy Signal
| The oversold reversal pattern is a bullish signal. It involves the DeMarker previous data points to be below the 0.3 thresholds trending up and crossing the oversold level. | 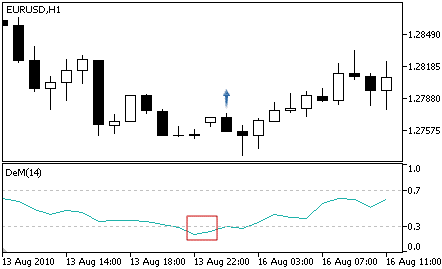
|
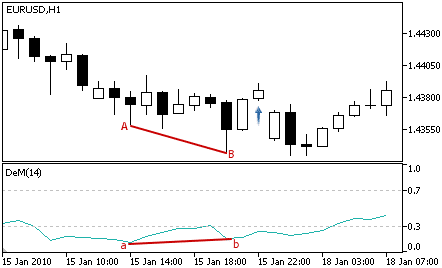
| A bullish divergence pattern is materialized when the DeMarker evolves below the oversold level and trending up while the underlying instrument’s price action continues to fall.
This type of divergence is a typical signal that implies an imminent reversal and, in that case, an upside potential. |
|
Sell Signal
| The overbought reversal pattern is a bearish signal. It involves the DeMarker previous data points to be above the 0.7 thresholds trending down and crossing the overbought level. | 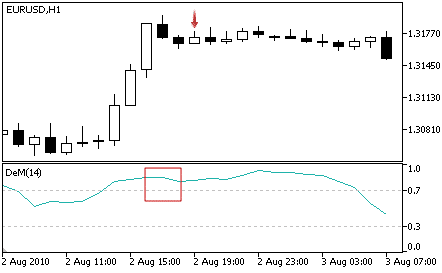
|
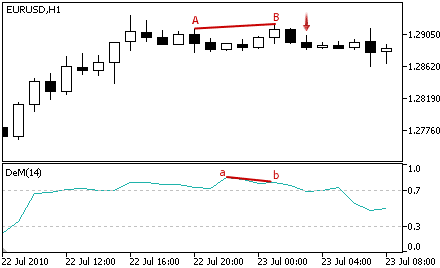
| A bearish divergence pattern is materialized when the DeMarker progresses above the overbought level and trending down while the underlying instrument’s price action continues to rise.
The bearish divergence is a typical signal that implies an imminent reversal and, in that case, a downside potential. |
|
How does the DeMarker indicator store its data points?
The DeMarker indicator keeps its data point in an indicator buffer which is the dynamic timeseries array we mentioned in the previous chapters on Bollinger Bands and CCI. The size of the array is managed automatically by MetaTrader when the Expert Advisor loads.
Therefore, the timeseries element with index zero contains the latest quote of a symbol. For instance, an indicator on the daily timeframe will have the current price at index zero and yesterday’s data at the position index one (Fig.184).

Fig.184 Indicator data points array
MQL5
To access the DeMarker data points, MQL5 requires the use of the CopyBuffer() function. This approach does not apply to MQL4 as the MQL4 indicators function directly returns the value of the DeMarker data point instead of the handle. The following parameters should be supplied:
- Provide the handle that is returned by the iDeMarker() function.
- Provide the buffer number. You may provide zero as the default value.
- Provide the start position. You may provide zero to retrieve from the most recent data point. This number represents the index where zero is the most recent data point, and one is the previous data point.
- Specify the number of data points to get from the iDeMarker() function.
- Provide the variable where the data will be stored. The variable is a double type.
How to retrieve the DeMarker data points with CopyBuffer() function?
- Declare a variable for the handle: int IndicatorHandle = iDeMarker();
- Declare a variable to store indicator data: double dem_indicator;
- Copy the data to the indicator variable and retrieve data points:
- CopyBuffer(IndicatorHandle, 0, 0, 100, dem_indicator);
- Retrieve a particular data point from the timeseries with dem_indicator[0], dem_indicator[1]. Note that the array is sorted descending, meaning that the most recent data point will be the zero index value of the timeseries array.

Fig.185 CopyBuffer() Function
How to access the indicator data?
MQL4
The iDeMarker() function will return the data point value according to these four parameters:
- The symbol of the traded instrument. You may provide a string such as “EURUSD” or use the function Symbol() to retrieve the symbol from the chart where the Expert Advisor is attached to.
- Provide the time frame using the enumeration value from the constant ENUM_TIMEFRAMES, for instance:
- PERIOD_CURRENT, for the current timeframe from the chart
- PERIOD_M1, for the one-minute timeframe,
- PERIOD_D1, for the daily timeframe.
- Specify the averaging period, and the default average is usually 14-period.
- Provide the index of the indicator buffer where zero is the latest data point, and one is the previous data point.

Fig.186 MQL4 DeMarker function
MQL5
When calling the iDeMarker() function, the function will create the DeMarker indicator in the MetaTrader global cache and returns its handle according to these specified parameters:
- The symbol of the traded instrument. You may provide a string such as “EURUSD,” or you can use the function Symbol() to get the symbol from the chart where the Expert Advisor is attached to.
- Provide the time frame of the data point to extract using the enumeration value from the constant ENUM_TIMEFRAMES:
- PERIOD_CURRENT, to get data points from the current timeframe from the chart to which the Expert Advisor is attached to,
- PERIOD_M1, for the one-minute timeframe,
- PERIOD_D1, for the daily timeframe.
- Specify the averaging period. Usually, the default average is 14-period.
Note that to retrieve data points from the iDeMarker() function, you need to use it in combination with the function CopyBuffer().

Fig.187 MQL5 DeMarker function
Practical case
MQL5
Fig.188 exhibits the use in MQL5 of the DeMarker indicator to generate a simple signal by spotting a divergence that occurs between the indicator data points and the underlying instrument’s price action. A divergence occurs when the trend between the indicator and the price action moves in the opposite direction. This event is typically followed by a price trend reversal.
Line 451: Declare the indicator handle and assign the content returned from the function iDeMarker().
Line 452: Declare the indicator array that will store data points.
Line 454 – 455: Declare the variables that specify the overbought and oversold threshold.
Line 457: Get the latest 100 bars and store them in the dem_indicator array.
Line 459 – 483: Conditional statement to identify the DeMarker data points trend and assess the price action directional trend. If the underlying instrument’s price diverges from the indicator data points trajectory, a signal is initialized accordingly.
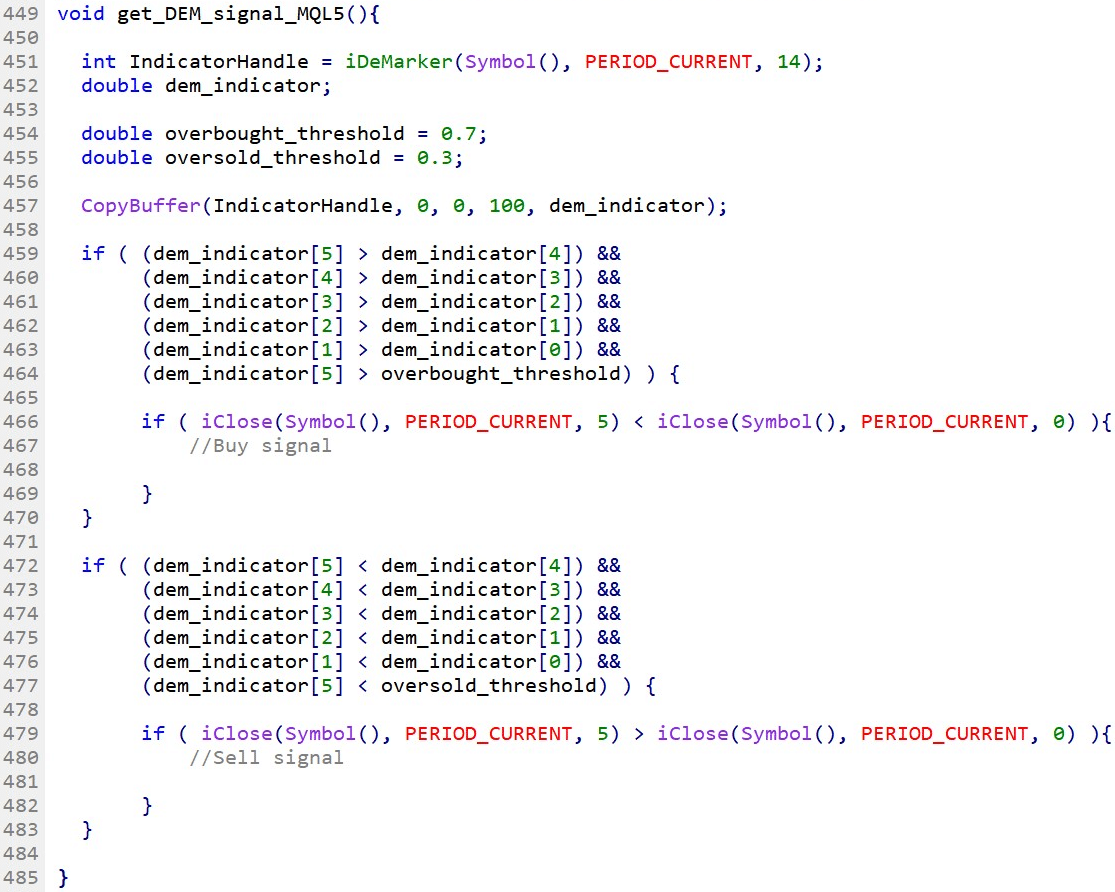
Fig.188 MQL5 example of a bullish and bearish divergence signal with the DeMarker indicator
MQL4
Fig.189 demonstrates the use in MQL5 of the DeMarker to create a simple signal from the divergence that may occur between the indicator trend and the price action of the underlying instrument.
Line 489 – 494: Declare variables to store the last six indicator’s data points and collect them with the function iDeMarker().
Line 496 – 497: Declare the variables that define the overbought and oversold threshold.
Line 499 – 523: Conditional statement to identify the DeMarker data points trend and assess the price action directional trend. If the underlying instrument’s price diverges from the indicator data points trajectory, a signal is initialized accordingly.
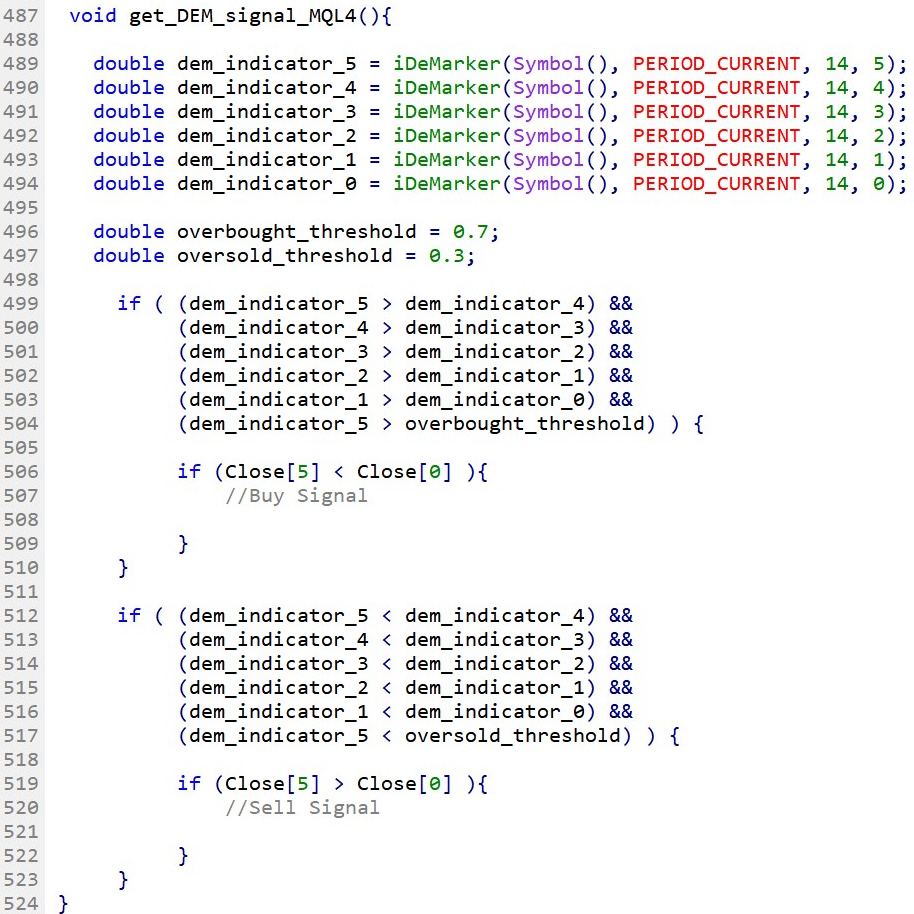
Fig.189 MQL4 example of a bullish and bearish divergence signal with the DeMarker indicator