There are several approaches to interpret the Envelopes indicator. The main approach is to identify upper or lower band price breakout, which occurs while price crossover the upper or lower band. The alternative approach is a mean reversion strategy, whereas price is projected to return to its midpoint upon reaching the upper or lower band. The Envelopes indicator consists of a fixed positive and negative deviation from the defined moving average, which is reflected by an upper and lower band (Fig.199).
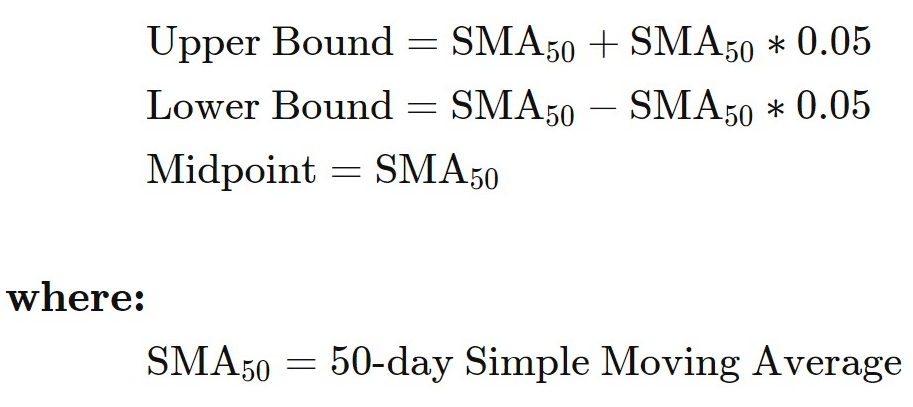
Fig.199 Envelopes Indicator formula
In this guide, we will go through how to detect a buy and a sell signal with the Envelopes indicator and go through the method to store the data points and how to retrieve them in a trading strategy. MQL4 Envelopes function retrieves the indicator’s data point. Conversely, MQL5 requires the data to be stored in the indicator buffer and in a declared “double type” array.
You will find it is a straightforward process as you go into the details step by step with us. And finally, we will show you a practical example of usage with ready-to-use code.
How does the Envelopes indicator work?
Before we go into the details of the Envelopes function implementation, let us explain the buy and sell signals interpretation. The Envelopes indicator is very similar to the Bollinger bands indicator. It uses a moving average as the midpoint and a fixed deviation for the upper and lower bands.
Buy signal
| A lower band crossover buy signal occurs when the price action evolves below the lower band and closes its bar above it. Typically, a crossover of the lower band signifies a possible upside reversal. | 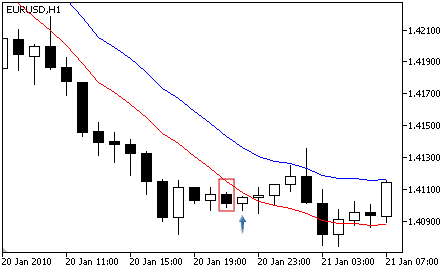
|
| A breakout trade can be identified when the underlying instrument crosses above the upper band, suggesting built-up momentum that may lead to an upside continuation. | 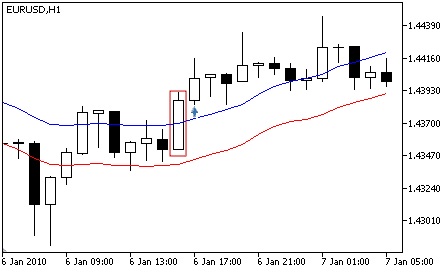
|
Sell signal
| A fading bullish move can be recognized when the underlying instrument crosses below the upper band after some time above it. A sell signal can be identified when the price action closes below the upper band. | 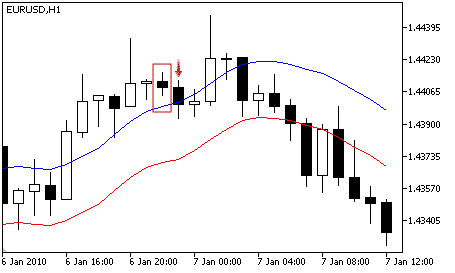
|
| A price action breakdown can be identified when the candlestick closed below the lower band. When the bar crosses below the lower band, a price drop can be anticipated. | 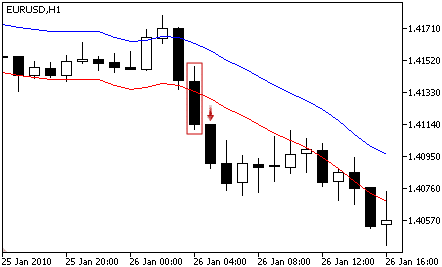
|
How does the Envelopes indicator store its data points?
The Envelopes indicator keeps its data point in an indicator buffer which is a dynamic array. The size of the array is managed by MetaTrader during the Expert Advisor initialization. An indicator buffer is a time-series array; hence it has the particularity of reverse indexing. It means that the array is sorted by descending where the latest data point is on the left side of the array. Time series is used to store historical data and comprise the time information.
Therefore, the time-series element with index zero contains the latest quote of a symbol. For instance, an indicator on the daily timeframe will have the current indicator bar at index zero and yesterday’s data at the position index one (Fig.200).
The Envelopes indicator has a particularity to have two buffers, one for the upper band and one for the lower band. The upper band data points are stored in the buffer index zero, while the lower band data points are saved in the buffer index one.

Fig.200 Indicator data points array
MQL5
To access the Envelopes indicator data, MQL5 requires the use of the CopyBuffer() function. This method does not apply to MQL4 as the MQL4 indicators function directly returns the Envelopes’ data point instead of the indicator handle. The following parameters should be provided to the CopyBuffer() function to retrieve the indicator data:
- The handle that is returned by the iEnvelopes() function.
- Provide the buffer number corresponding to the upper or lower band.
- Zero for the upper band.
- One for the lower band.
- Provide the start position. You may provide zero to retrieve from the most recent data point. This number represents the index where zero is the most recent data point, and one is the previous data point.
- Specify the number of data points to get from the iEnvelopes() function.
- Provide the variable where the data will be stored. The variable is a double type.
How to retrieve the Envelopes data with CopyBuffer() function?
- Declare a variable for the handle: int IndicatorHandle = iEnvelopes();
- Declare two variables to store the upper and lower band data points:
- double env_indicator_upper;
- double env_indicator_lower;
- Copy the data to the indicator variables and retrieve data points
- CopyBuffer(IndicatorHandle, 0, 0, 100, env_indicator_upper);
- CopyBuffer(IndicatorHandle, 0, 1, 100, env_indicator_lower);
- Retrieve Envelopes data point with:
- env_indicator_upper[0], env_indicator_upper[1];
- env_indicator_lower[0], env_indicator_lower[1];

Fig.201 CopyBuffer() Function
How to access the indicator data?
MQL4
The iEnvelopes() function will return the data points according to these nine parameters:
- The symbol of the traded instrument. You may provide a string such as “EURUSD” or use the function Symbol() to retrieve the symbol from the chart where the Expert Advisor is attached to.
- Provide the time frame using the enumeration value from the constant ENUM_TIMEFRAMES, for instance:
- PERIOD_CURRENT, for the current timeframe from the chart,
- PERIOD_M1, for the one-minute timeframe,
- PERIOD_D1, for the daily timeframe.
- Provide the moving average period. The default setting is a 20-period SMA.
- Specify the averaging method by providing an enumeration constant ENUM_MA_METHOD:
- MODE_SMA, for a simple averaging,
- MODE_EMA, for an exponential averaging,
- MODE_SMMA, for a smoothed average,
- MODE_LWMA, for a linear-weighted averaging.
- Provide the moving average shift. The default value is zero.
- Specify the applied price using the enumeration value from the constant ENUM_APPLIED_PRICE:
- PRICE_CLOSE, for the close price,
- PRICE_OPEN, for the open price,
- PRICE_HIGH, for the highs within the specified period,
- PRICE_LOW, for the lows within the specified period.
- Provide the price deviation of the Envelopes upper and lower band from the moving average in percentage.
- Specify which data points to collect:
- MODE_MAIN, for midpoints,
- MODE_UPPER, for the upper band,
- MODE_LOWER, for the lower band.
- Provide the index of the indicator buffer where zero is the latest data point and one the previous data point.
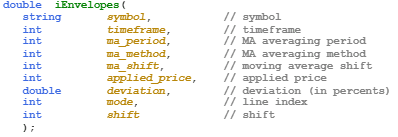
Fig.202 MQL4 Envelopes function
MQL5
When calling the iEnvelopes() function, the function will create the Envelopes data points in the MetaTrader global cache and returns its handle according to the following parameters:
- The symbol of the traded instrument. You may provide a string such as “EURUSD” or you can use the function Symbol() to get the symbol from the chart where the Expert Advisor is attached to.
- Provide the time frame of the data point to extract using the enumeration value from the constant ENUM_TIMEFRAMES:
- PERIOD_CURRENT, to get data points from the current timeframe from the chart to which the Expert Advisor is attached to.
- PERIOD_M1, for the one-minute timeframe
- PERIOD_D1, for the daily timeframe.
- Specify the moving average period. The default setting is 20-period.
- Provide the horizontal shift of the indicator. The default value is zero.
- Specify the averaging method with the enumeration value from the constant ENUM_MA_METHOD:
- MODE_SMA, for the simple averaging.
- MODE_EMA, for the exponential averaging.
- MODE_SMMA, for the smoothed average.
- MODE_LVMA, for the linear-weighted averaging.
- Provide the applied price method with the enumeration value from the constant ENUM_APPLIED_PRICE:
- PRICE_CLOSE, for the close price.
- PRICE_OPEN, for the open price.
- PRICE_HIGH, for the highs within the specified period.
- PRICE_LOW, for the lows within the specified period.
- Specify the price deviation of the Envelopes indicator upper and lower band from the moving average expressed in percentage.
Note that to retrieve data points from the iEnvelopes() function, you need to use it in combination with the function CopyBuffer(). You may need to declare two dynamic arrays to store the upper and lower band data points.

Fig.203 MQL5 Envelopes function
Practical case
MQL5
Fig.204 demonstrates the use of the Envelopes indicator to generate a price breakout and price breakdown trading strategy using the upper and lower band crossover to identify signals.
Line 6: Declare the indicator handle and assign iEnvelopes() function handle with the specified parameters.
Line 7 – 8: Declare the indicator “double type” array to store the Envelopes data points.
Line 10 – 11: Copy the latest hundred data points for each data set. Note the upper band buffer index is zero while the lower band buffer index is one.
Line 13 – 27: IF statement to assess the underlying instrument’s price action with the indicator upper and lower band to define the condition of the buy and sell signal.
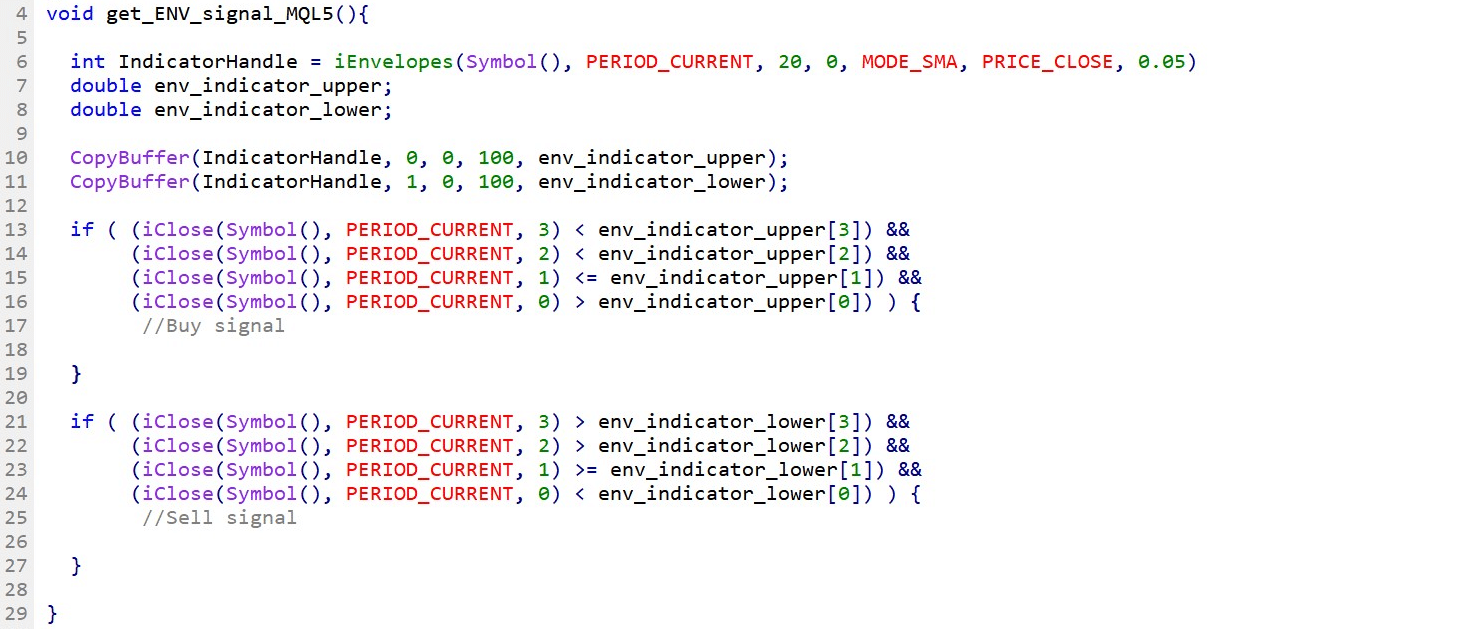
Fig.204 Envelopes indicator breakout and breakdown strategy in MQL5
MQL4
Fig.205 demonstrates the use of the Envelopes indicator to create a simple price breakout and price breakdown trading strategy. A buy and sell signal is identified when the underlying instrument’s price crosses the upper or the lower band.
Line 34 – 42: Declare variables that store the indicator’s data points. Note, the last parameter from the function iEnvelopes() is the index that defines the data points position where zero is the most recent data.
Line 45 – 62: IF statement to assess the underlying instrument’s price action with the indicator upper and lower band to define the condition of the buy and sell signal.
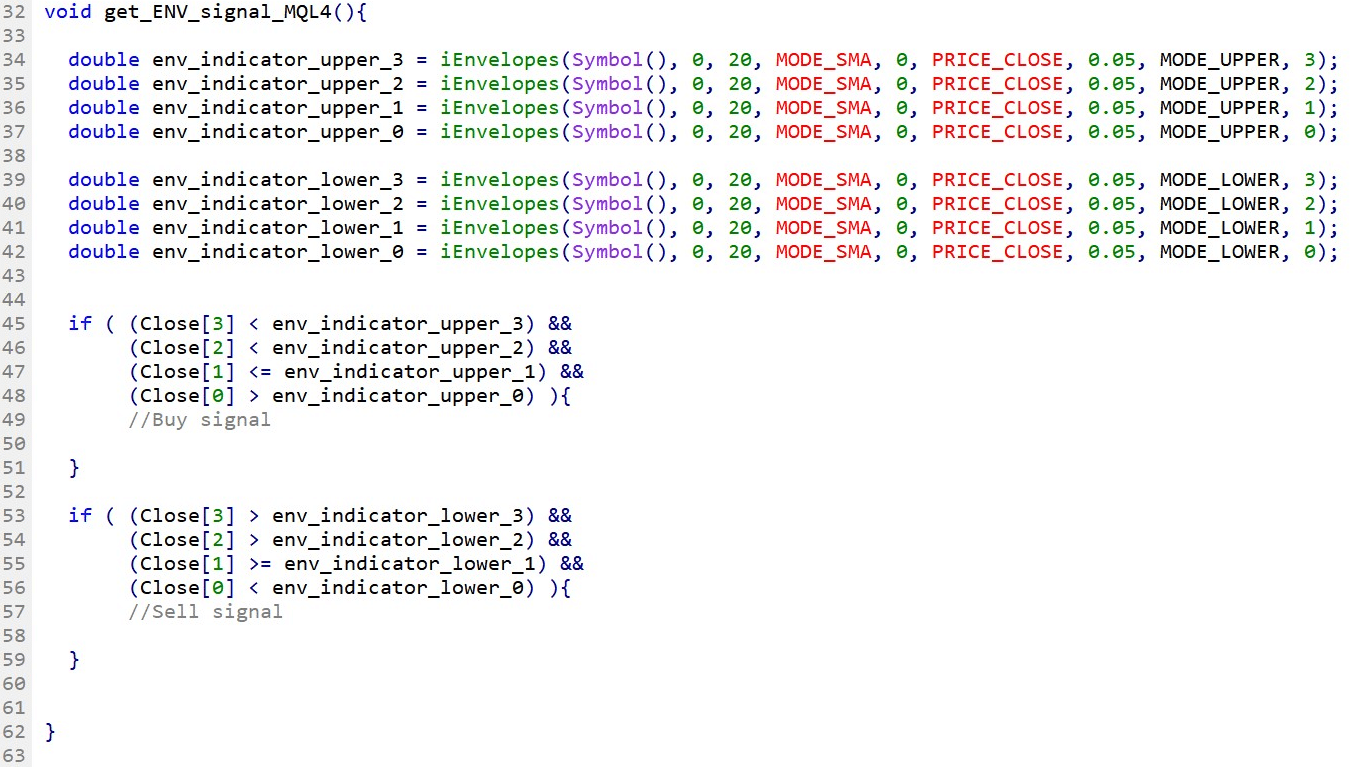
Fig.205 Envelopes indicator breakout and breakdown strategy in MQL4