Fractals are tags that appear on the chart to notify the trader of a potential level where the price can reverse or slow down. Therefore, this indicator can be employed in four different scenarios to find support and resistance level, to set an adequate trailing stop, to look for breakout signals, and to prospect for a trend continuation. In mathematical terms, a fractal is a repeating geometric pattern. Translated into chart reading, fractals are repeated patterns on all-time frames and are isolated to recognize potential turning points. A bullish fractal is distinguishable by a low point with two higher-low bars on each side of it. Conversely, a bearish fractal is identified by a high point surrounded by lower-high bars.
As illustrated in Fig.190, the fractals formula isolates the high and low of N point on the chart. If two lower highs to the left of the high or two higher lows to the left of the low of (N -2) and (N -1), a fractal may be identified upon the next two following bars. In case two lower highs occur after a high, a bearish fractal is formed. Conversely, if two higher lows occur after a low, a bullish fractal is recognized.
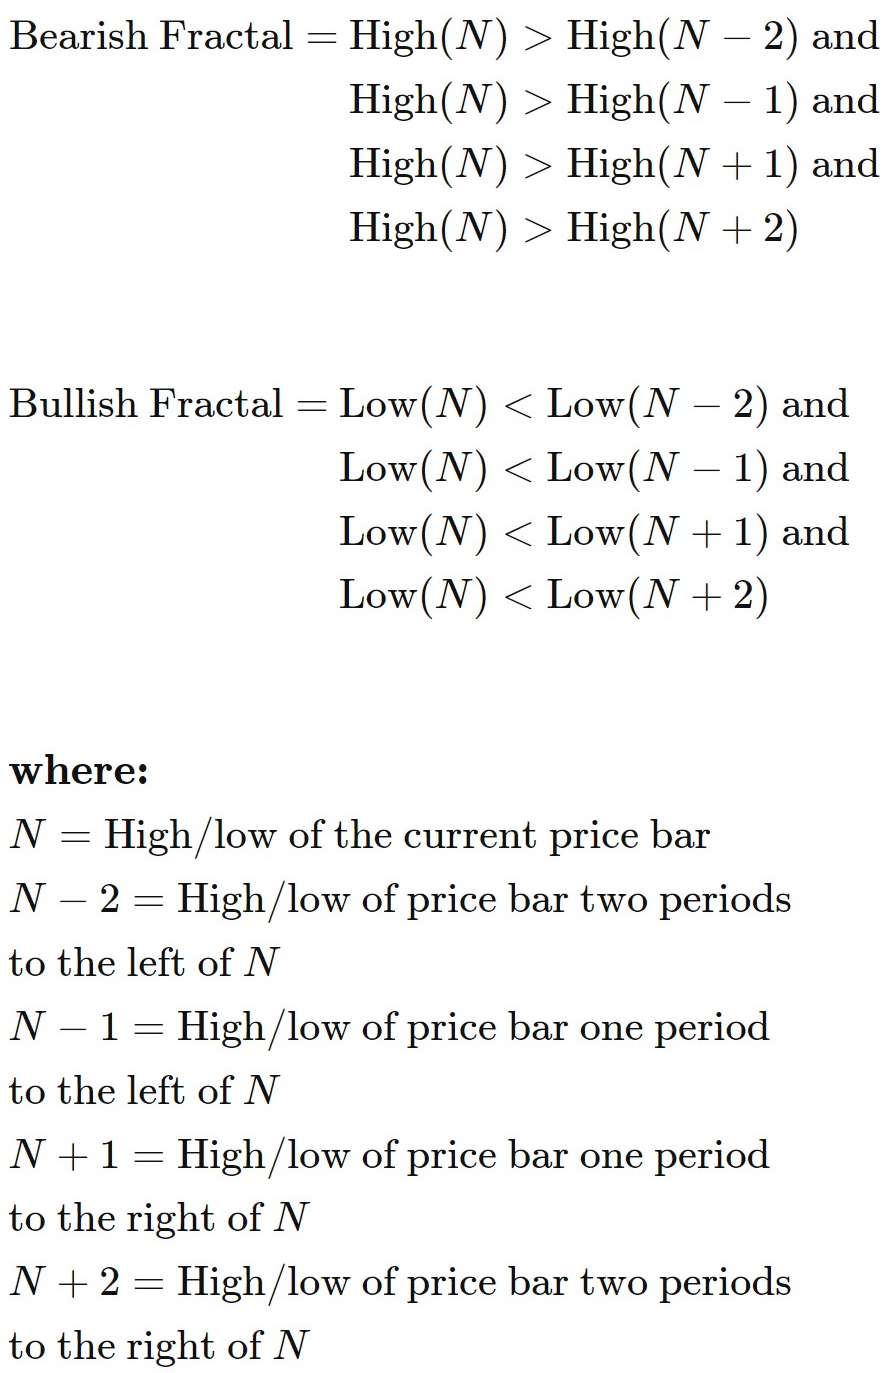
Fig.190 High and low points of the fractals
In this guide, we will go through how to detect a buy and a sell signal with Fractals and explain to you how to store the data points and how to retrieve them for further use. MQL4 Fractals function retrieves the indicator’s data point. Conversely, the MQL5 platform requires the data to be stored in the indicator buffer and in a declared “double type” array. We will explain this functionality step-by-step. To conclude this guide, we will show you a practical example of Fractals in a real case scenario.
How does the indicator signal work for the Fractals indicator?
Before we dive into Fractals’ code implementation. Let us explain the buy and sell signals interpretation.
As shown in Fig.191 and Fig.192, a fractal can be used to determine support and resistance areas, which may offer potential reversal or continuation signals.
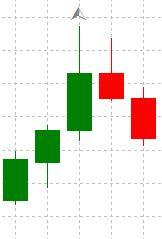
Fig.191 A potential resistance level according to the fractal formed above a candle |
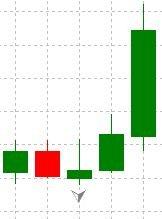
Fig.192 A potential support level according to the fractal formed below a candle |
How does the Fractals indicator store its data points?
The Fractals indicator keeps its data point in an indicator buffer, or the dynamic timeseries array. The size of the array is handled by MetaTrader when the Expert Advisor is initialized. Should you choose the daily time frame, today’s elements will be the zero index, i.e., the start of indexation, and the data collected yesterday will occupy the index position one in the array.
MQL5
To access the Fractals data points, MQL5 requires the use of the CopyBuffer() function. This approach does not apply to MQL4 as the MQL4 indicator functions directly retrieve the value of Fractals data points instead of the handle. To retrieve Fractals data points, the following parameters should be provided:
- Assign the indicator handle that is returned by the iFractals() function.
- Provide the buffer number. You may provide zero as Fractals only have one series of data points.
- Provide the start position. You may provide zero to retrieve from the most recent data point. This number represents the index where zero is the most recent data point, and one is the previous data point.
- Specify the number of data points to get from the iFractals() function.
- Provide the variable where the data will be stored. The variable should be a double type.
How to retrieve the iFractals data points with CopyBuffer() function?
- Declare a variable for the handle: int IndicatorHandle = iFractals().
- Declare a variable to store indicator data: double frac_indicator.
- Copy the data to the indicator variable and retrieve data points
- CopyBuffer(IndicatorHandle, 0, 0, 100, frac_indicator);
- Retrieve a particular data point from the time-series with frac_indicator[0], frac_indicator[1]. Note that the array is sorted with the most recent data to the oldest data, meaning that the most recent data point starts at zero.

Fig.193 CopyBuffer() Function
How to access the indicator data?
MQL4
The iFractals() function will return the data point value according to these four parameters:
- The symbol of the traded instrument. You may provide a string such as “EURUSD” or use the function Symbol() to retrieve the symbol from the chart where the Expert Advisor is attached to.
- Provide the time frame using the enumeration value from the constant ENUM_TIMEFRAMES, for instance:
- PERIOD_CURRENT, for the current timeframe from the chart,
- PERIOD_M1, for the one-minute timeframe,
- PERIOD_D1, for the daily timeframe.
- Specify the data point index to retrieve using the “indicators line identifiers”:
- MODE_UPPER
- MODE_LOWER
- Provide the index of the indicator buffer where zero is the latest data point and one the previous data point.

Fig.194 MQL4 Fractals function
MQL5
When calling the iFractals() function, the function will create the Fractals indicator in the MetaTrader global cache and returns its handle according to two provided parameters:
- The symbol of the traded instrument. You may provide a string such as “EURUSD,” or you can use the function Symbol() to get the symbol from the chart where the Expert Advisor is attached to.
- Provide the time frame of the data point to extract using the enumeration value from the constant ENUM_TIMEFRAMES:
- PERIOD_CURRENT, to get data points from the current timeframe from the chart to which the Expert Advisor is attached,
- PERIOD_M1, for the one-minute timeframe,
- PERIOD_D1, for the daily timeframe.
Note that to retrieve data points from the iFractals() function, you need to use it in combination with the function CopyBuffer().

Fig.195 MQL5 Fractals function
Practical case
MQL5
Fig.197 exhibits the use in MQL5 of the Fractals indicator to generate a simple signal by collecting fractal tags on the chart to identify support and resistance area for potential price reversal and continuation. A fractal is formed above or below a bar or candlestick that defines the price level to consider for a buy or sell signal.
Line 581 – 585: Declare variables that will store the fractal status and the fractal price level. The fractals_limit variable defines the limit number of data points to collect.
Line 587: Declare the variable that will hold the indicator handle from the function iFractals().
Line 588 – 589: Declare the arrays that will be used to store the upper and lower fractal data points.
Line 590 – 591: Assign the indicators data collected from the indicator buffer. Note the second parameter from the function CopyBuffer() acts as the buffer index. Zero corresponds to fractals that are formed above bars and candlesticks, while one relates to fractals that are formed below bars and candlesticks.
Line 593 – 622: Function to identify Fractals data points. Get_fractals_MQL5() updates variables that define the last bullish and bearish fractals and stores price levels in variables fractals_up_price and fractals_down_price.
Line 627: the function get_fractals_MQL5() is called to update fractal variables such as price levels for further use and to generate buy and sell signals.
Line 629 – 637: Conditional statement to identify a price breakout by comparing the current close price with the fractal price levels.
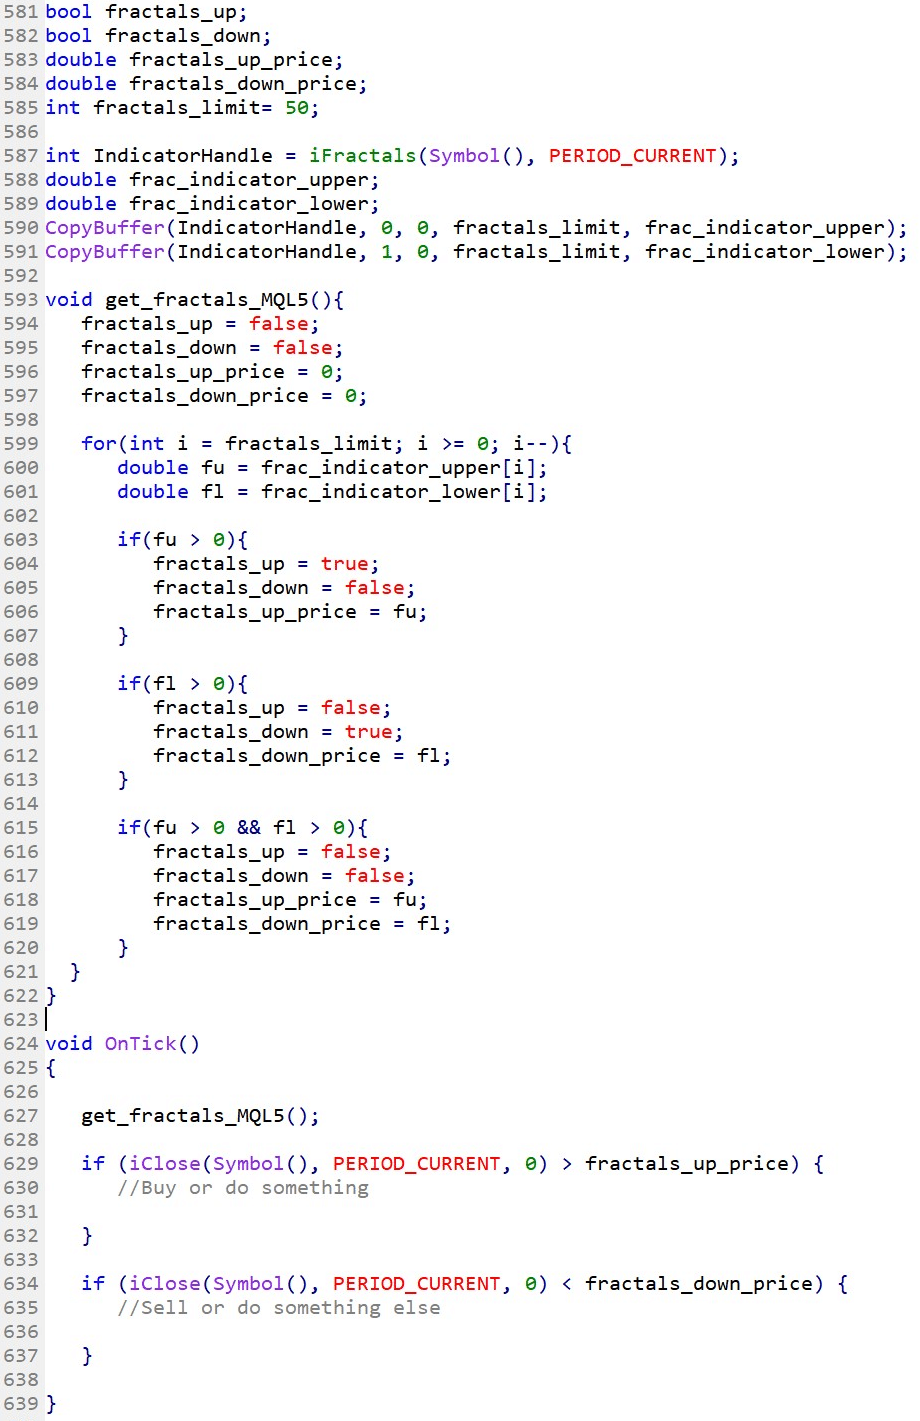
Fig.196 Example of a reading of the fractals indicator in MQL5
MQL4
Fig.198 demonstrates the use in MQL4 of the Fractals indicator to create a simple signal by collecting fractal tags on the chart to identify support and resistance levels for potential price reversal and continuation. A fractal is generated above or below a bar or candlestick that defines the price level to consider for a buy or sell signal.
Line 526 – 530: Declare variables that will store the fractal status and the fractal price level. The fractals_limit variable defines the limit number of data points to collect.
Line 532 – 561: Function to identify Fractals data points. Get_fractals_MQL4() updates variables that define the last bullish and bearish fractals and stores price levels in variables fractals_up_price and fractals_down_price.
Line 566: the function get_fractals_MQL4() is called to update fractal variables such as price levels for further use and to generate buy and sell signals.
Line 568 – 576: Conditional statement to identify a price breakout by comparing the current close price with the fractal price levels.
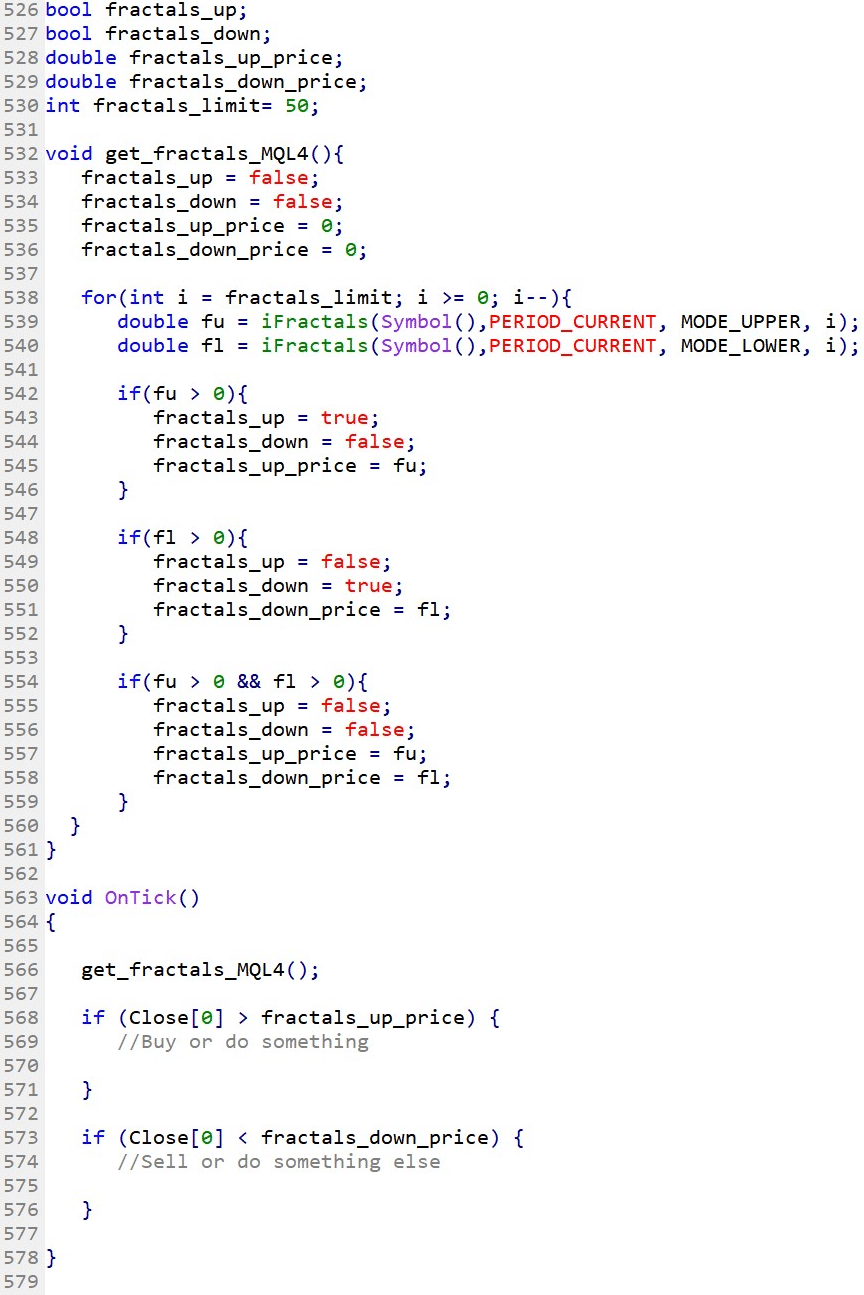
Fig.197 Example of a reading of the Fractals indicator in MQL4