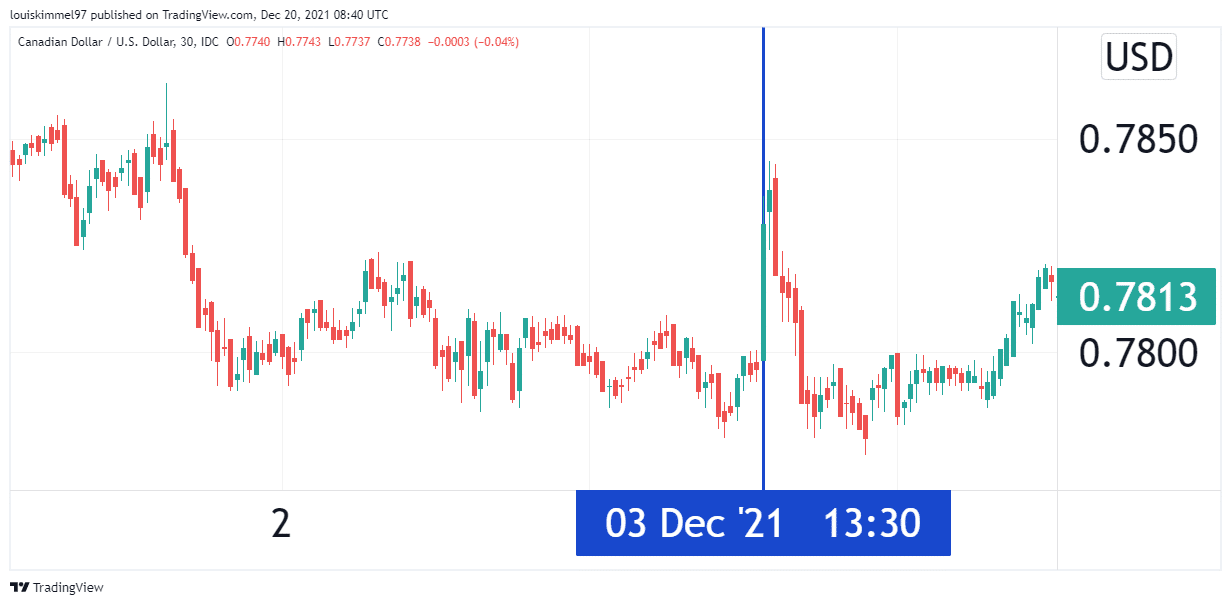
The USDCAD currency pair, which represents the Canadian Dollar to the US Dollar, is one of the most popular currencies in Forex. It is one of the seven main currency pairings that contain the US dollar, and it is a particularly liquid currency pair. Traders typically look at non-farm payrolls (NFP) while trading the employment numbers in USDCAD. In the currency market, the NFP data is one of the most anticipated economic news releases.
What is the importance of NFP to forex traders?
NFP is used to calculate the number of new jobs created in the preceding month. Most non-agricultural jobs are included in the study. However, private home employees, government employees, farm employees, and nonprofit employees are excluded.
As one of the most anticipated economic news events of the month, the USDCAD sees large market moves in the minutes and hours after the release of the data. This presents a fantastic chance for day traders who have a strong approach to profit from the resultant volatility.
When the NFP is released, FX traders start looking for information that will tell them which currency to buy. In the case of the USDCAD, if the unemployment rate is lower than the previous month’s report and the NFP rises, it implies that the USD will be stronger than the CAD. Therefore, traders will start shorting the USDCAD pair in the hopes that the value of USD will rise further. If the unemployment rate rises and the NFP declines, traders view it as a sign of a weakening dollar and thus will buy into the CAD.
Let us look at an example using December 2021 NFP data.

In December 2021, the US NFP data declined from 546K to 210K. This was negative for the greenback. Meanwhile, in Canada, the unemployment rate declined from 6.7% to 6%. This was positive for CAD. This culminated in a bullish trend for the USDCAD pair before retracing.
Trading steps
1. Identify a trade
To locate a suitable trade following the release of NFP data, you need to observe the direction of the initial reaction to the data’s release. A suitable profit target for trading this report is 20 pips. The larger the initial move, the better it is for determining the pair’s price direction.
Following the initial large move, a price retreat normally follows, signaling an entry point. First, draw a trendline from the high of the first move to the high of the price retreat using one-minute price bars if the initial move was up. When the price breaks above this trendline, enter a buy trade.
Conversely, if the first move was down, a trendline is drawn from the low of the original move to the low of the price retreat using the same criteria. When the price breaks below the trendline, enter a short trade. Some traders prefer to wait for five price bars before drawing the trendline, while others use fewer. This all depends on personal preferences. This practice would also aid in the placement of a stop-loss order in case the price bar that was chosen was not the real price pullback low.
If a trader follows the 5-price-bar approach, the stop loss should be one pip below the movement’s bottom if the trade is long. If the trade was taken short, the stop loss should be one pip (plus the spread amount) above the high established on the five-price-bar movement.
2. Select a take profit
Traders use the difference between the starting price and the initial move to determine the take profit. The difference is reduced by half, and the resulting figure is set as the target price. The profit target, for example, would be 65 pips if the original move was 130 pips.
3. Define the risk
Your trade risk in pips is the difference between your stop loss and entry point. Your profit potential in pips is the difference between your profit target and the entry point. Take a trade only if the profit potential is at least 1.5 times the trade risk. It should ideally be 2 times or more.
4. Choose the position size
Only put one percent of your capital at risk on a trade. That implies your transaction risk should not exceed 1/100 of your account, multiplied by the number of lots you buy.
Trading NFP for swing traders
NFP is an excellent medium-term approach. The price movements within a few weeks are frequently influenced by unemployment figures, and the market follows the direction specified by NFP. This data indicates whether the month will be bearish or bullish for traders. Swing trading is a simple approach that traders may employ in conjunction with their own bespoke tactics.
Commodities that are affected by NFP in Canada
Oil
Oil is the leading commodity in Canada. The NFP is an economic statistic data report that influences demand for oil, gas, and energy. A positive NFP leads to increased energy use in homes, businesses, workplaces, and travel. However, it is difficult for NFP to predict the direction of oil prices alone accurately.
Gold
Gold is the second leading commodity in Canada. The dollar’s impact on the gold price is what causes the NFP effect. If there is physical or industrial demand in the economy, a high NFP increases the price of gold.
Conclusion
Employment data is one of the most significant economic factors that influence the price of the Canadian dollar against the US dollar. The NFP report from the United States is the most important of these employment numbers. A reading that is higher than expected is bullish for the US dollar and negative for the pair, whilst a reading that is lower than expected is positive for USDCAD. Because the Canadian dollar is a commodity currency, the NFP has an impact on Canada’s most important commodities, such as gold and crude oil.