Gaps are one of the essential unique bar formations in trading. Chart gaps can be seen as a noticeable difference between two price bars. An untraded territory is what we refer to as a “price gap.”
A “gap fill” occurs when the price resumes trading in a previously inactive zone.
A gap up occurs when the current candle’s low exceeds the preceding candle’s high.
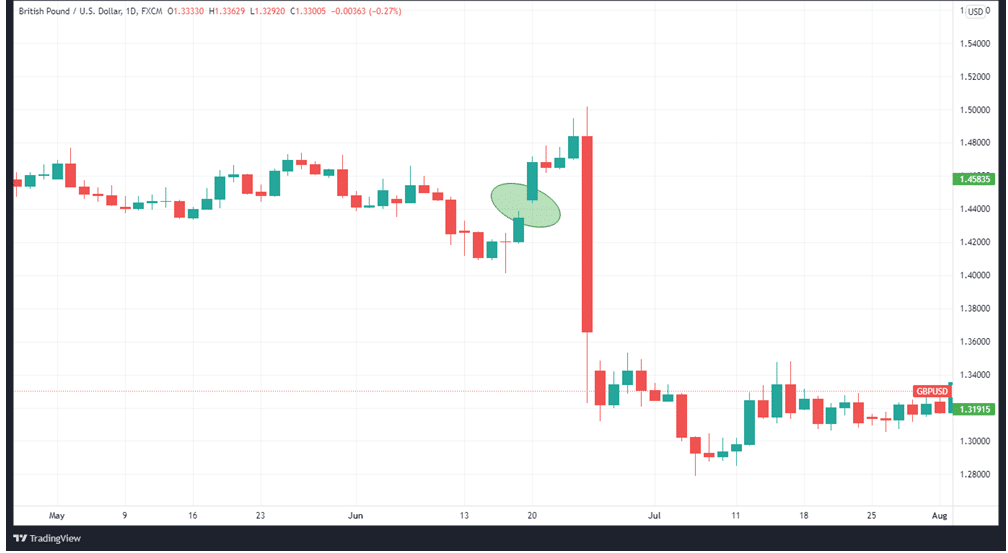
If the peak of the current candle is below the low of the preceding candle, then there is a gap down.
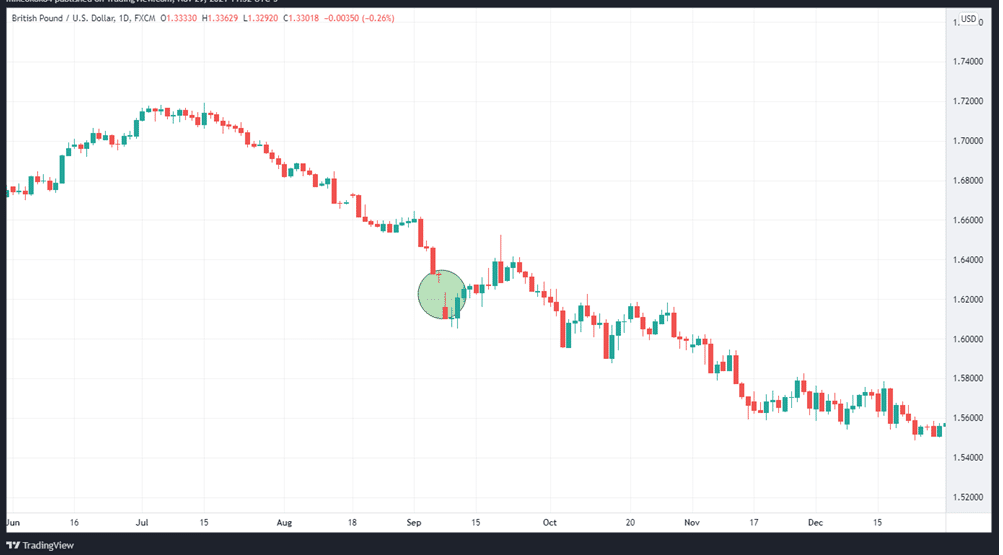
Gaps in the price of an asset can have a variety of meanings depending on the context in which they occur.
Breakaway gaps
Breakaway gaps are significant because they nearly invariably herald the beginning of a new trend. This sort of gap arises after a price consolidation or when the overall trend is in the opposite direction of where the price is currently.
Condictions
The gap must fulfill the following conditions to qualify as a breakaway gap:
- Ensure that the trading range is more significant than usual. For instance, we can tell that there were substantial market changes when the daily high and low price gaps were $10 for security that generally trades within a $5 range.
- Be formed when the price is experiencing a mild trend or going sideways. You can’t see anything happening on the chart until suddenly there’s a drastic shift in the trajectory. Supply-and-demand dynamics change as a result of new information.
Direction
Depending on supply and demand, a breakaway gap is seen as either upward or downward:
- Upward breakaway gap: In order to get their hands on security, customers are prepared to pay ever-increasing prices. There is a noticeable increase in volume.
- Downside breakaway gap: Investors are desperate to get out of their positions and are willing to accept lower prices in order to do so. It’s possible that the volume is unreasonably high.
There is a clear breakaway gap to the downside on this chart after the asset spent some time in consolidation. The gap indicates that a fresh decline is beginning.
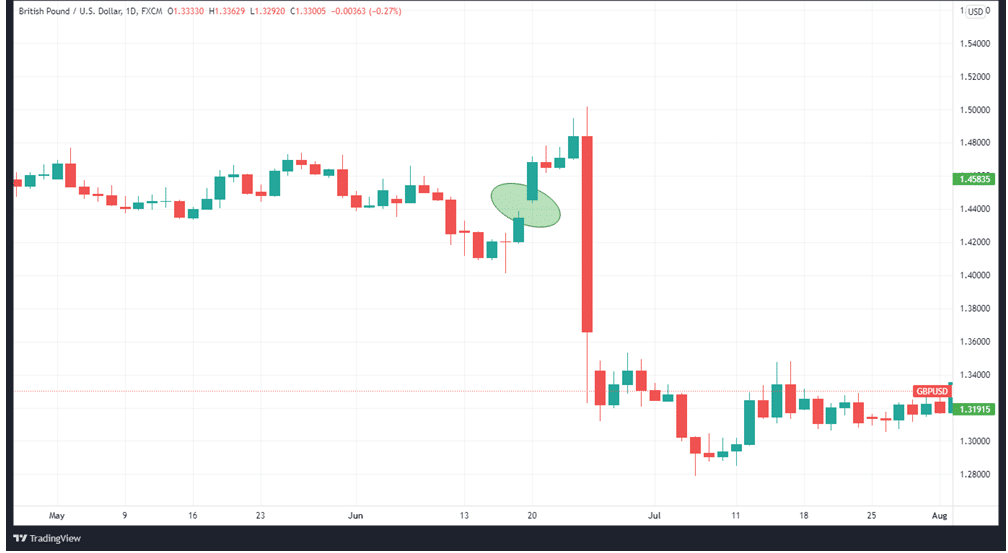
A breakaway gap would have traders aligning transactions in the direction of the breakout rather than attempting a contrarian strategy.
Runaway gaps (or measuring gaps)
A runaway gap occurs when new information reinforces an already well-established pattern of security movement.
By definition, when the price of an asset breaks a runaway/measuring gap, it means that the market has found its natural path. Because they tend to occur before the resumption of the preceding trend, breakaway gaps are termed continuation chart patterns.
When the trend is going down, a breakaway gap down indicates the impending continuation of the depreciation. Following the gap’s appearance, traders can be able to predict the duration of the trend that precedes the gap in order to offer them a “measured” objective. This is how the phrase “measuring” gap was coined.
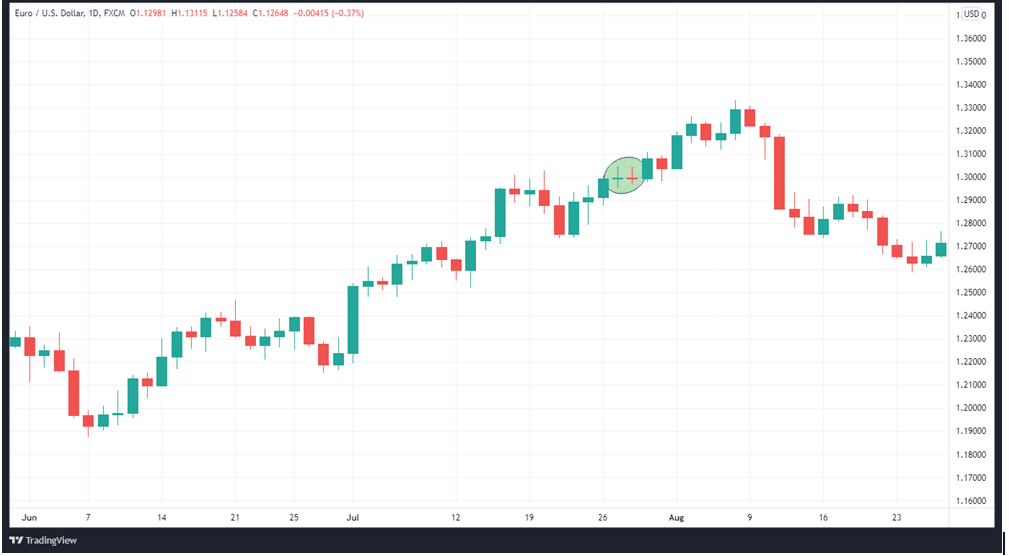
The chart above shows a measurement gap in an upswing.
An example of a Runaway gap trade
Assume we’re keeping tabs on GBPUSD price. Friday’s closing price is 1.3400, but Monday’s opening price is 1.3450. We placed purchase order on the GBPUSD pair at 1.3460 after noticing an upsurge in trading activity.
Since in recent days, we’ve seen an increase in prices, this is reflected in the direction of the price gap. In contrast to when a new trend is beginning, we proceed with extreme caution.
This trade was closed out later in the day at 1.3500, as the GBPUSD pair continued to rise throughout the day. Therefore, we end up with a profit of 100 pips.
Exhaustion gap
The end of market bearishness or bullishness is often marked by exhaustion gaps, which occur in the same direction as the current trend. Unlike runaway gaps, they have substantially higher trading volumes.
Exhaustion gaps can be an early indicator that a trend has come to an end. As soon as the gap closes, the price tends to follow suit and then quickly reverses direction, giving way to a new trend.
For example, during a bullish trend, when an exhaustion gap comes at the end, investors rush to buy the asset as last-minute euphoria wave crests. Shortly thereafter, however, there will be a period of sharp profit-taking and dwindling interest in the asset, which will signal the beginning of a new downward trend.
Example of a trading exhaustion gap
Let’s take an instance where the GBPUSD pair closes at 1.2191 on Friday but opens at 1.2044 on Monday with trading volumes that have risen significantly. This signals that the buyers are coming in despite the “fall” in the price.
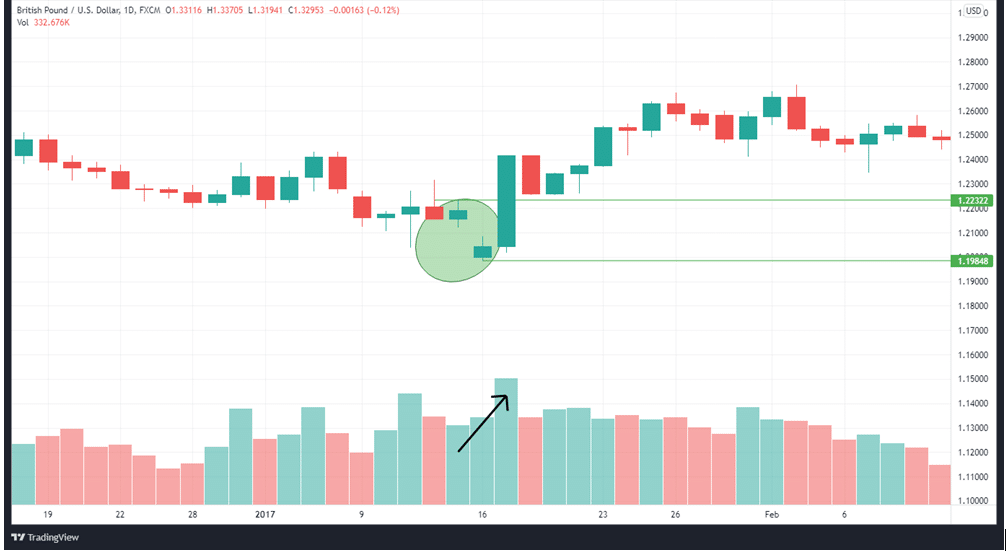
We, therefore, initiated a sell order at 1.2232, where the GBPUSD pair initially recorded a high before the gap. We make a decent profit of 147 pips when the price rises well past the buy order at 1.2191.
In summary
When done correctly, gap trading may be quite profitable. In the event of a breakaway gap, it signals that a new trend in the reverse direction to the underlying trend has begun. Midway through a trend, a runaway or measurement gap occurs, showing the price moving easily in a direction, expecting the directional trend to be extended. When a trend creates an exhaustion gap, it signals the trend’s surrender and predicts a trend reversal is imminent.