When you work with the Ichimoku Cloud indicator, it is possible to isolate the trades that have better chances of generating profits. Although it is a relatively new introduction to the Forex market, many new and seasoned traders have incorporated it into their trading schemes. It depicts numerous statistical points that allow the Forex traders to analyze price action more efficiently.
What is the Ichimoku Cloud indicator?
Created in Japan during the 1960s, this is a modified candlestick formation that allowed to foresee price shifts with increased accuracy. Since it consists of several lines, novice traders may struggle to make sense of this indicator, but expert Forex traders know how to utilize it for making their decisions.
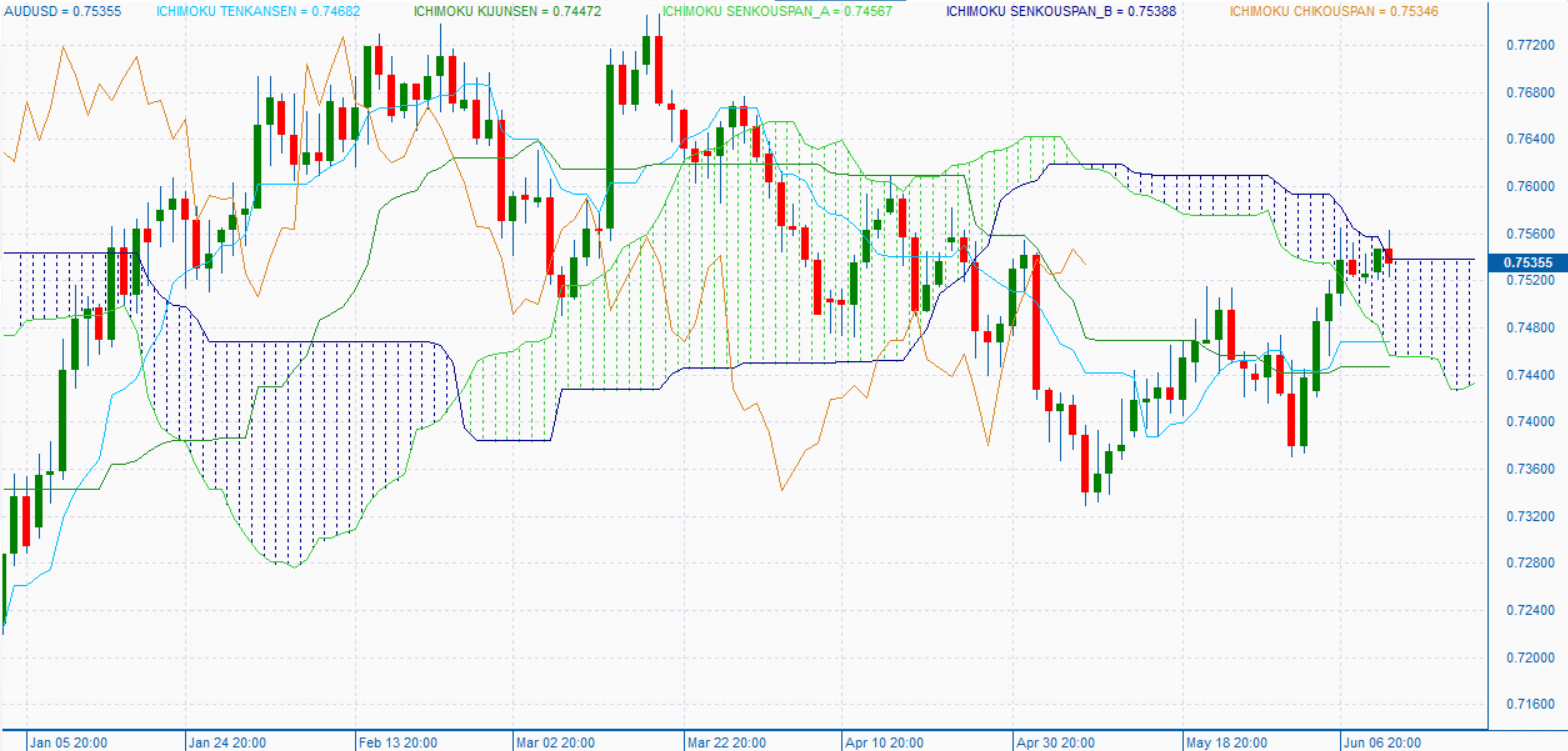
The Ichimoku Cloud comprises five lines, with every one of them providing valuable statistics related to price position. The space formed in between two such lines constitutes a cloud. A majority of traders working with this indicator concentrate on this space.
Different components of the indicator

A typical Ichimoku will comprise of the 5 parts detailed below:
-
Tenkan Sen
This part is depicted on the chart as a red line. It represents the 9-day MA line. You can see the mean highs and lows for the earlier 9 periods. The line oscillates swiftly as the prices rise and fall. You have a trending market if the oscillation occurs vertically and a ranging one if it is horizontal.
Tenkan Sen is calculated by adding the highest high and lowest low 9 periods and dividing the sum by 2.
-
Kijun Sen
This particular line indicates how the prices are going to shift in the near future. The blue-colored line represents the 26-day MA showing the average of the lows and highs for the preceding 26 days. Since the period for this line is longer, its rate of movement is slower, leading to flatness developing in particular zones.
During a bullish phase, this acts as a vital support plane, and when there is a downtrend, it acts as the resistant plane. If the tenken and the price line lie over this line, it is an indication of a bullish trend. In the same way, if they lie beneath kijun sen, a downtrend is indicated.
A flat kijun sen line tells you that the market is consolidated. An uptrending crossover takes place when the tenken sen line intersects kijun sen from below, and a downtrending crossover is characterized by the tenken sen intersecting the kijun sen from the top.
The kijun sen line can be calculated using the following formula:
(26-Period High + 26-Period Low) / 2
-
Chikou Span
The green line on the chart represents the Chikou span. It is formed when you shift the end rate backward up to 26 periods. If this line crosses the price line from below, you get a purchase signal. On the other hand, you get a sell signal when the crossing occurs from above.
-
Senkou Span A
This is a leading indicator showing the average peaks and lows of the first two lines and is plotted 26 periods forward. This line is orange in color, and once the pair’s price lies above it, it turns the upper and lower limits into primary and secondary support levels, respectively. Resistance levels are created in a similar fashion when the price lies beneath the orange line.
We can calculate Senkou Span A as:
(Tenkan-Sen + Kijun Sen) / 2
-
Senkou Span B
This line is computed by considering the middle point of the previous 56 periods. Owing to the period being so long, it remains mostly flat. When the pair’s price lies above this line, you can take it as a support level, and when the converse is true, you can regard it as a resistance line.
The calculation for Senkou Span B is as follows:
Senkou Span B = (52-Period High + 52-Period Low) / 2
How to use it for placing trades

Here is a guide for trading using this indicator:
- Price break: The primary thing to look for is the price break, and you also need to study where it closes in relation to the cloud. It is over the cloud, and it shows you that a bullish trend is about to begin. When a price break involves the cloud, it is an indication of the market fluctuating. Before entering the trade, you need to look for highlighted support and resistance levels.
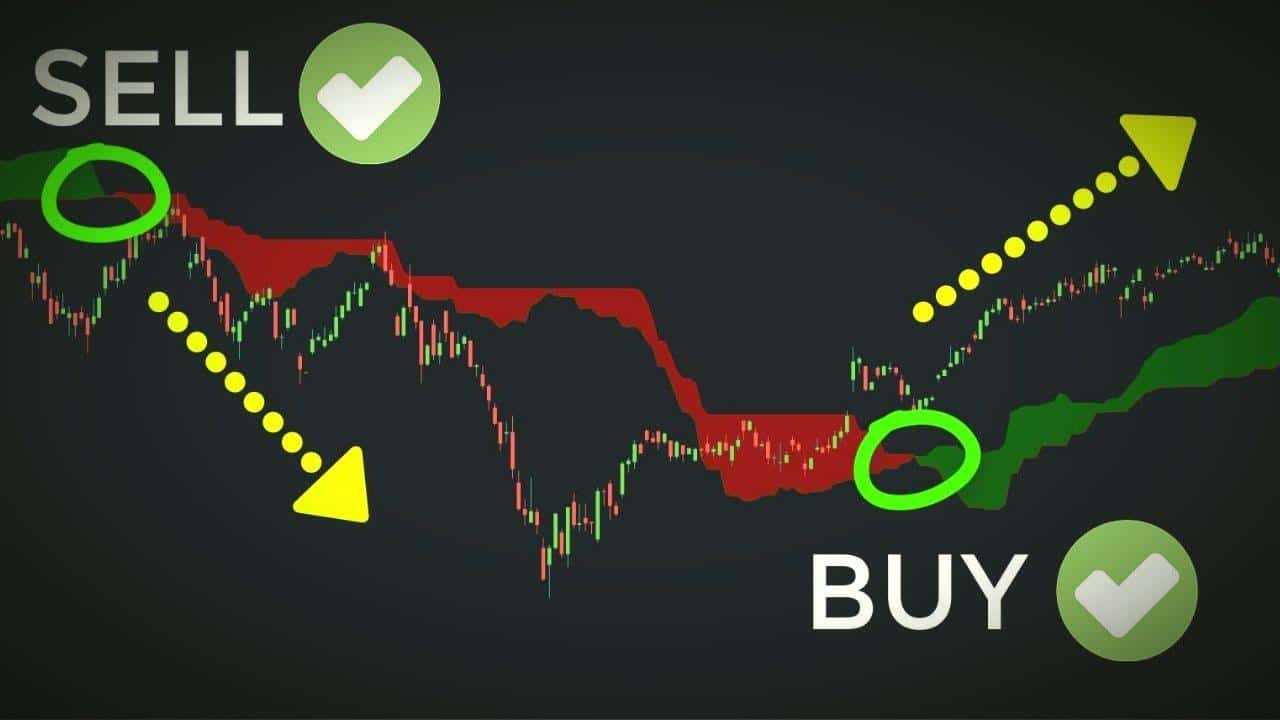
- Crossover: After confirming the presence of the layers, you must stand by for the crossover. This occurs when the baseline is broken by the conversion line. A trade can be entered when the price reaches out beyond the cloud, followed by a crossover.
- Entering trades: Generally, you should enter a trade only when the pair’s price lies above the cloud. Once the crossover occurs, you can open a trade at the succeeding candle’s opening point.
Stop placement and exit

There are two ways you can execute an exit with the Ichimoku Cloud indicator. The conventional method to do this is to stand by for the base and conversion lines to cross in a countertrend direction. This is done in order to avoid pre-reversal uncertainty, but it may lead to a trader missing out on further trend shifts.
Conversely, if you wish to trade the trends for the long haul, make an exit when the line breaks through the cloud in a countertrend direction. While this lets you hold on to your trades for longer, it can lead to late exits. Stop losses are best placed under the breakout candle’s lowest point.
Conclusion
Now you have a candid concept of the Ichimoku Cloud indicator. Using it on charts for Forex trading will not be a hardship anymore. Novice traders should gain some familiarity about chart formations and market volatility before using this indicator.